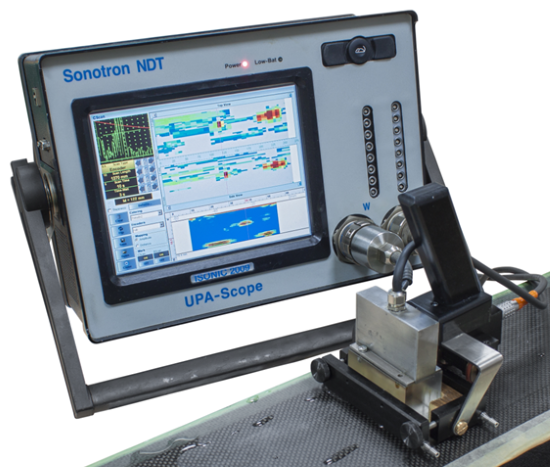
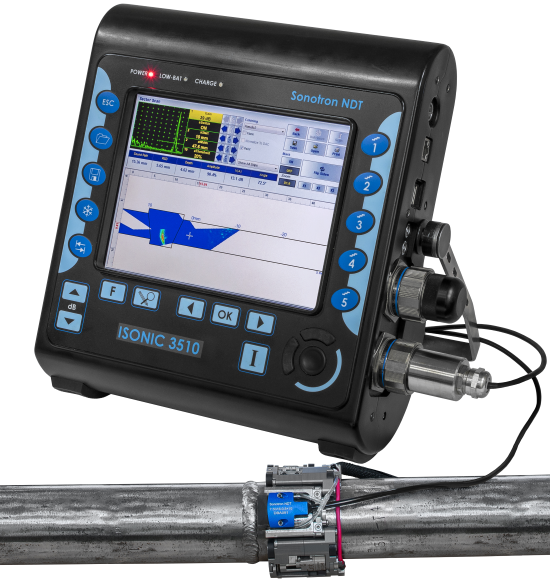
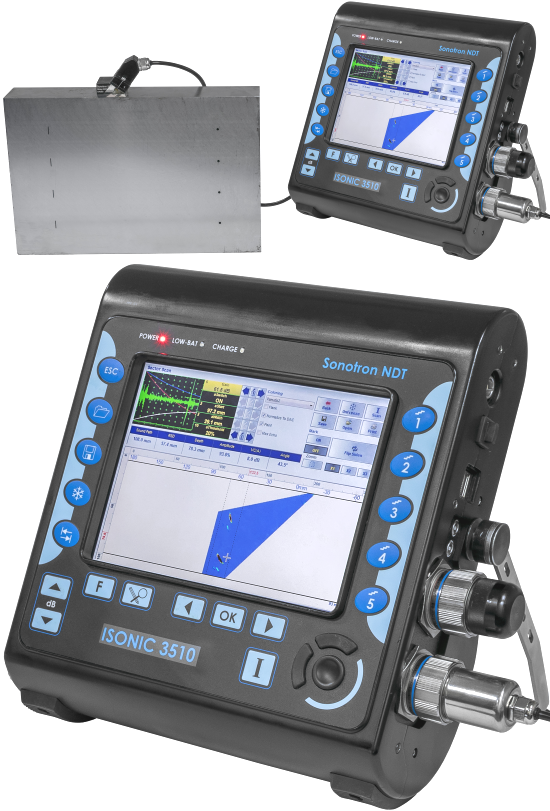
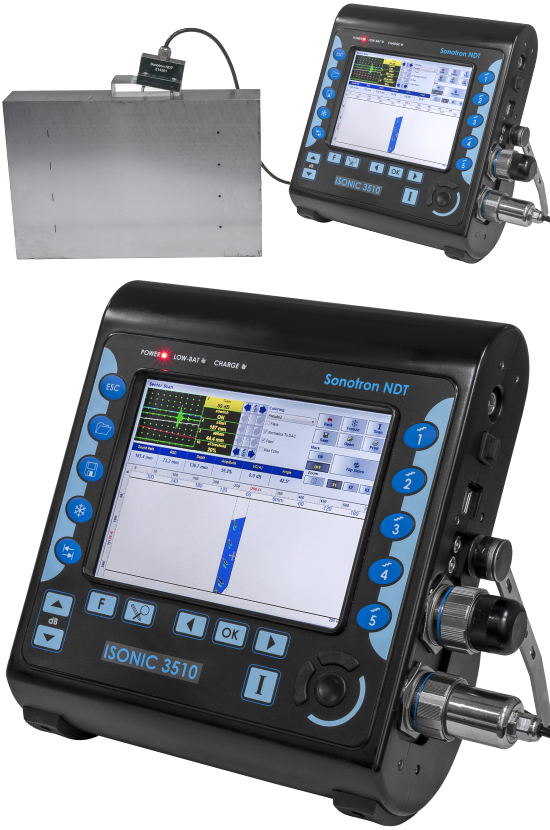
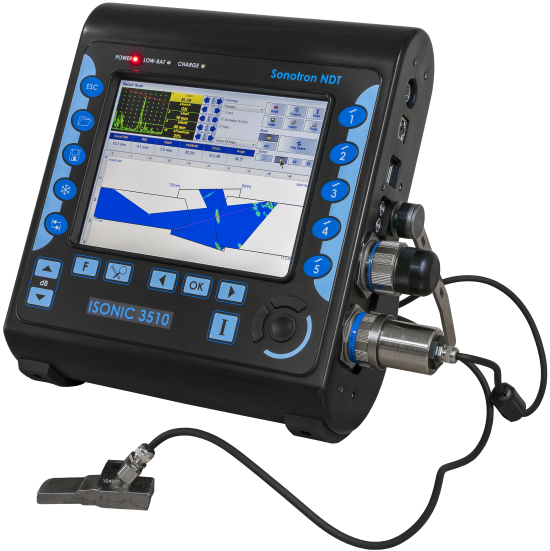
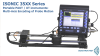
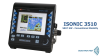
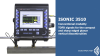
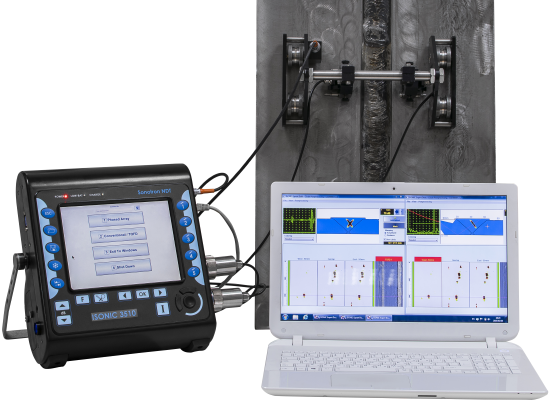
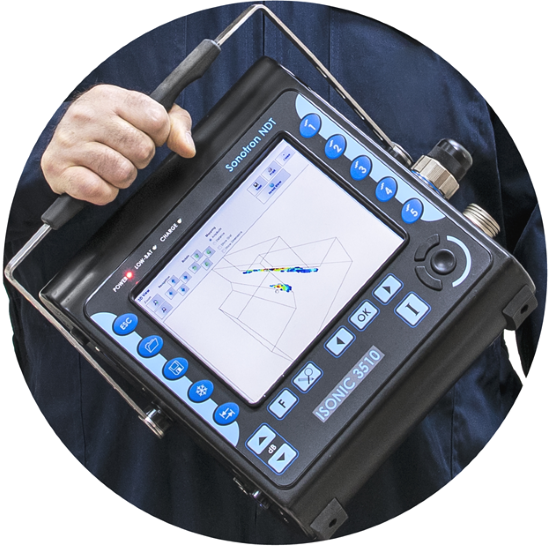
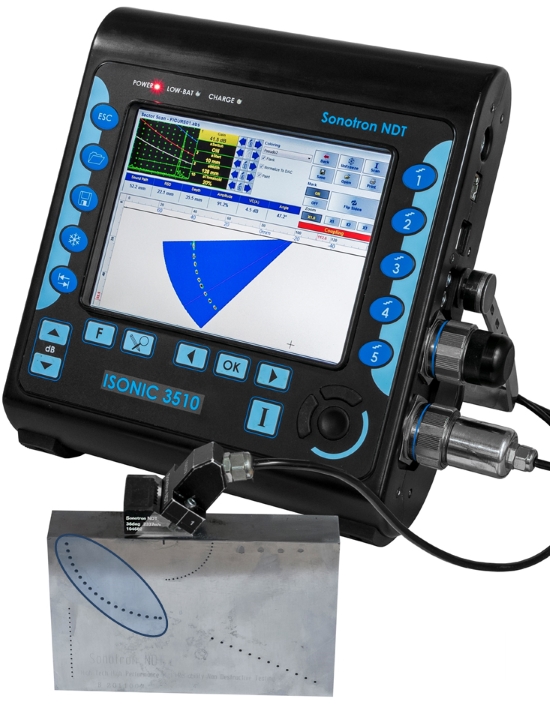
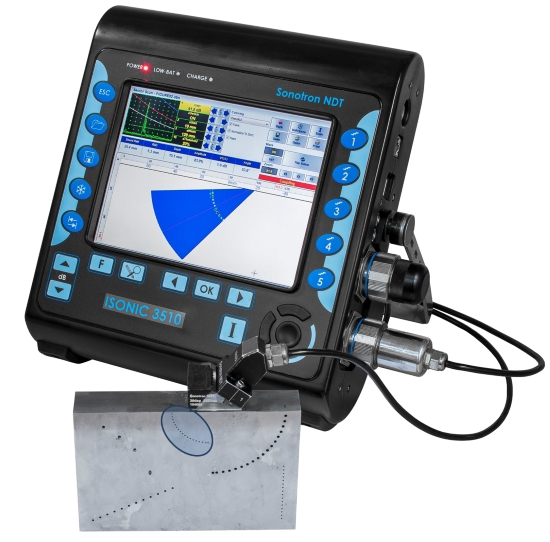
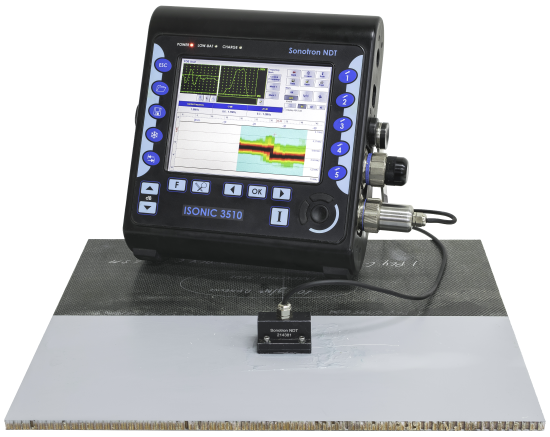
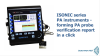
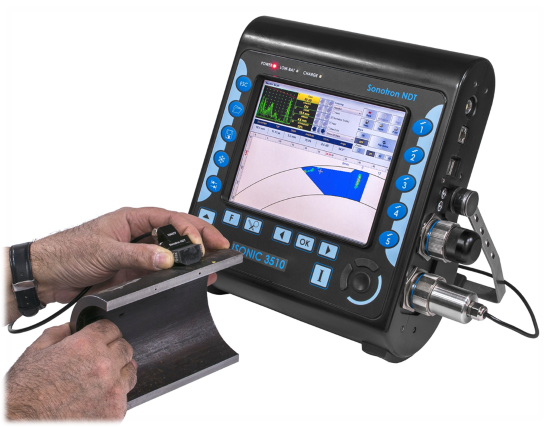
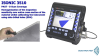
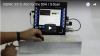
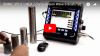
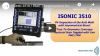
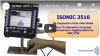
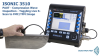
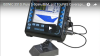
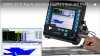
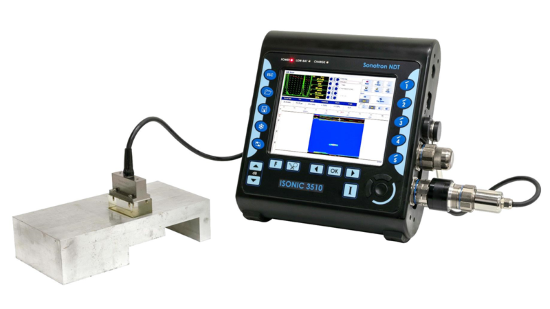
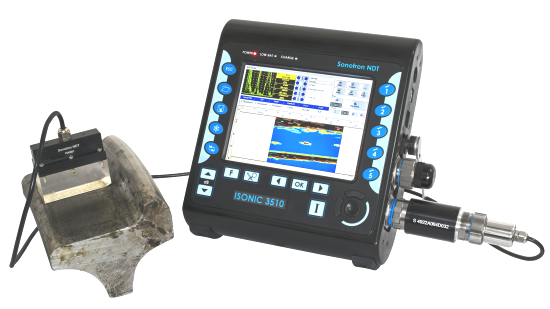
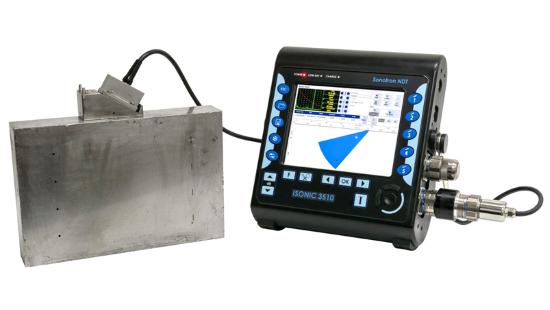
Portable Smart All-in-One Superior Performance Phased Array Ultrasonic Flaw Detector and Recorder with 2 Additional Conventional UT / SRUT GW / TOFD Channels
Designed and built under the drive for improved detection, productivity, and reducing of inspection cost ISONIC 3510T as well as its famous 8-years-elder brother ISONIC 3510 resolves the well-known nowadays
challenges faced by NDT and QA management such as increasing of nomenclature and complexity of inspections combined with more demanding codes, standards, and norms along with significant loss of domain expertise.
ISONIC 3510T is a turbo-charged-performance version of ISONIC 3510 providing significantly higher speed of scanning, data recording and processing and opening new opportunities for the improvement of inspection reliability.
Full cross-compatibility of the calibration and inspection results files created by both instruments and their standard and customized optional inspection software packages and accessories provides seamless integration of
ISONIC 3510T into all established procedures created during almost decade for the ISONIC 3510 dramatically increasing the speed of scanning and inspection productivity
ISONIC 3510T / ISONIC 3510 instruments carry the application based smart platforms for the regular and advanced ultrasonic testing delivering
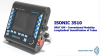
6 inspection modalities ñ PA, TOFD, CHIME, SRUT GW, uSpectroscopy (Ultrasonic Spectroscopy), conventional UT and a combination of them
outstanding ultrasonic performance and probability of detection
built-in image guided scan plan creator (ray tracer) for the numerous types of simple and complex geometry welds, shafts, bolts, spindles, composite profiles, and the like
simplicity and intuitiveness of operation and data interpretation
rapidness in the creation of the new inspection solutions and procedures
easily expandable on-board solutions base
reduced training time and cost
comprehensiveness of automatically created inspection reports
The optimal suitability of ISONIC 3510T / ISONIC 3510 for resolving of the huge variety of inspection tasks for all industries and processes involving ultrasonic NDT are strongly
backed by the above listed features and technical particulars and specs below
Flaw Detection and Thickness / Corrosion Mapping
True-To-Geometry Volume Overlay and 3D Coverage and Imaging for:
Butt Welds (Planar and Circumferential) with
Symmetrical or Asymmetrical Bevel or Unbeveled
Equivalent or Different Thickness of Jointed Parts
Longitudinal Welds
Fillet, Tee-, and TKY- Welds - Flat and Curved Parts
Corner and Nozzle Welds
Open Corner and Edge Welds
Lap Joints
Elbow and Transit Welds
Simple and Complex Geometry Solid and Hollow Shafts and Axles
Drill Rods, Bridge Hanger Pins, Bolts
Turbine Blades
Flat and Curved Carbon Fiber, Glass Fiber, Honeycombs Parts Including Corners and Radius Areas
etc
TOFD
CHIME (Creeping & Head Wave Inspection Technique)
SRUT GW (Short Range Guided Wave)
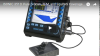
Operating 1 or 2 PA Probes Simultaneously: No External Splitter Required
Versatile Fully Parallel PA Functionality Out of the Same Unit:
1 X 16:16
2 X 16:16
1 X 32:32
2 X 32:32
1 X 64:64
2 X 64:64
1 X 128:128
Freely Adjustable Emitting and Receiving Aperture
Testing Integrity:
100% Raw Data Capturing
EquPAS ñ Equalized (Homogenized) Phased Array Ultrasonic Testing Sensitivity Over Entire Scan Plan
Scanning Performance Monitoring, On-Line Displaying, and Recording
Quantitative Scanning Integrity Report
Live True-To-Geometry FMC/TFM Imaging optioned with PWI and CPI
Ultrasonic Spectroscopy: FFT and FD B-Scan (Frequency Domain B-Scan)
Fully parallel 32:32 PA electronics expandable to 128:128
2 PA probe terminals - there is no external splitter required for operating 2 PA probes simultaneously
Ability of work with PA probes carrying up to 128 elements
Built-In PA Probe / Wedge / Delay Line Editor
Semiautomatic Routine for Quick Verification of Geometry (Dimensions and Angle), Velocity and Array Placement for wedges with flat and contoured contact face
Independently adjustable emitting and receiving aperture with parallel firing, A/D conversion, and on-the-fly real time digital phasing
Phased array pulser receiver with image guided ray tracing / scan plan designer for the numerous types of simple and complex geometry welds, shafts, bolts, spindles, composite profiles, and the like
8192 independently adjustable focal laws
On-the-fly focal law editing ability
Bi-polar square wave initial pulse: up to 300 Vpp / 100 dB analogue gain / 0.2...25 MHz bandpass / 16 bit 100 MHz ADC / 32 taps smoothly tunable digital filter
Regular and volume overlay true-to-geometry (true-to-shape) B-Scan / Sector Scan (S-Scan) / Horizontal Plane S-Scan (CB-Scan) coverage accompanied with all-codes-compliant A-Scan based evaluation
Multigroup coverage composed of several cross-sectional B- and S-Scans (scan plans) out of the same probe simultaneously
Interface Echo start
Strip Chart
Single group and multigroup Top (C-Scan), Side, End View imaging formed through encoded / time-based line scanning, 3D-Viewer
Single side / both sides weld coverage with use of one PA probe / pair of PA probes
TOFD Map out of a pair of PA probes
Top (C-Scan), Side, End View imaging formed through encoded XY- scanning, 3D-Viewer
Scanning performance monitoring and recording along with inspection data: scanning speed, coupling monitor, and lamination checker under the wedged probe
Equalized (homogenized) cross sectional coverage sensitivity: TCG-independent gain per focal law adjustment providing pure angle gain compensation (AGC) for S-Scan, etc
DAC, TCG applied to defects imaging and evaluation in real time or at the postprocessing stage (DAC / TCG image normalization)
Dynamic Focusing
FMC/TFM optioned with PWI and CPI, Back Diffraction Technique with / without and Mode Conversion
Distinguishing and evaluation of diffracted and mode converted signals for defects sizing and pattern recognition
Operating Linear Array (LA), Ring Array (RA), Daisy Array (DA), Matrix Array (MA), Dual Matrix Array (DMA), Dual Linear Array (DLA), and other PA probes
Ultrasonic Spectroscopy: FFT signal analysis for defect pattern analysis and materials structure characterization and FD B-Scan (Frequency Domain B-Scan) for rapid material structure screening, other special tasks
100% raw data capturing
Automatic finding and alarming defects / generating of editable defects list immediately upon scanning completed or at the postprocessing stage
Advanced defects sizing and pattern recognition utilities
Conventional UT and TOFD:
2 channels
Single / dual modes of pulsing/receiving for every channel
Bi-polar square wave initial pulse: up to 300 Vpp / 100 dB analogue gain / 0.2...25 MHz bandpass / 16 bit 100 MHz ADC / 32 taps smoothly tunable digital filter
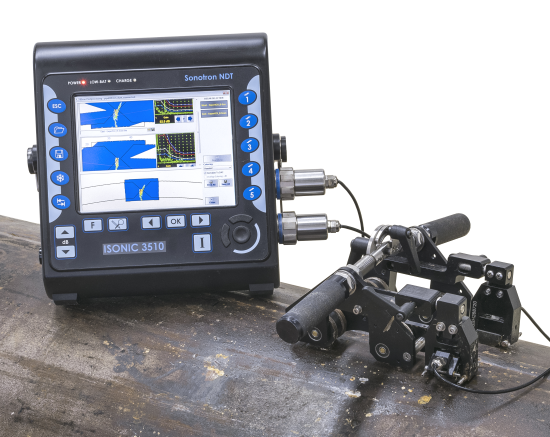
ISONIC 3510T / ISONIC 3510 uniquely combine PA, single- and multi-channel conventional UT, and TOFD modalities providing 100% raw data recording and imaging. Along with the intuitive user interface, portability, lightweight, and battery operation
this makes it suitable for all kinds of every-day ultrasonic inspections
PA modality is carried by the fully parallel non-multiplexed 32:32 electronics with independently adjustable emitting and receiving aperture, each may consist of 1...32 elements when operating one PA probe
or 1...16 elements per probe in case of operating two PA probes simultaneously. 2 PA probes terminals allow operating of a pair of PA probes simultaneously with no need in an external splitter. 64- and 128-elements
PA probes may be used with ISONIC 3510T / ISONIC 3510 when connected to instrumentís terminals through miniature active extenders, which expand the functionality to fully parallel 1 X 64:64, 2 X 32:32, 1 X 128:128, and 2 X 64:64
(no multiplexing involved). The groups of PA probe elements forming emitting / receiving aperture may be fully or partially matching or totally separated allowing maximal flexibility whilst managing the incidence
angles, focal distances, types of radiated and received waves including directly reflected and diffracted signals either mode converted or not
Each channel is equipped with own pulser-receiver and A/D converter. Parallel firing, A/D conversion, and îon-the-flyî digital phasing are performed for every possible composition and size of the emitting and receiving aperture
so the implementing of each focal law is completed within a single pulsing/receiving cycle providing the maximal possible speed of material coverage
ISONIC 3510T / ISONIC 3510 allow using of various types PA probes: linear, rings, and daisy arrays (LA, RA, and DA), dual linear arrays (LA), matrix arrays (MA), dual matrix arrays (DMA), etc
In addition to PA electronics ISONIC 3510T / ISONIC 3510 carriy 2 independent conventional channels for regular UT, TOFD, SRUT GW and other types of advanced inspection, imaging, and recording; each channel is capable
for both single and dual modes of use
The top level ultrasonic performance is achieved through firing PA, TOFD, and conventional probes with bipolar square wave initial pulse with wide-range-tunable duration and amplitude (up to 300 Vpp). The
high stability of the initial pulse amplitude within entire duration of the positive and negative half-waves, the extremely short boosted rising and falling edges and the automatic adaptive damping improve the signal
to noise ratio and resolution allowing controlling of the analogue gain over the 0Ö100 dB range for each modality
ISONIC 3510T / ISONIC 3510 provide a very powerful platform for huge number of the practical PA UT software applications available for the activation at any moment. Thanks to unique True-To-Geometry Volume Overlap Coverage and Real Time Imaging
ISONIC 3510T / ISONIC 3510 are suitable for high performance inspection of simple and complex geometry welds (butt, longitudinal, fillet, lap, corner, elbow, etc) with scanning from one or both sides simultaneously (when applicable), bolts,
bridge hanger pins, wind turbine and other shafts, annular rings, flanges, rails and railway axles and wheels, CRFP and GRFP composite panels and profiled stuff, and the like. Precise and easy reproducible automatic Equalizing (Homogenizing)
of the Sensitivity within Entire Cross-Section / Volume of the Material is provided thanks to the unique TCG-independent angle gain / gain per focal law compensation solution combined with DAC / TCG image normalization. Along with 100% raw
data capturing and scanning performance monitoring, on-line displaying, and recording this provides the Highest Degree of Testing Integrity
Thanks to True-To-Geometry Volume Overlap Coverage and Imaging and Equalizing (Homogenizing) of the Sensitivity within Entire Cross-Section / Volume of the Material the inspection results produced by ISONIC 3510T / ISONIC 3510
are quickly and easy interpretable and well acceptable by the UT Pros and non-Pros as well
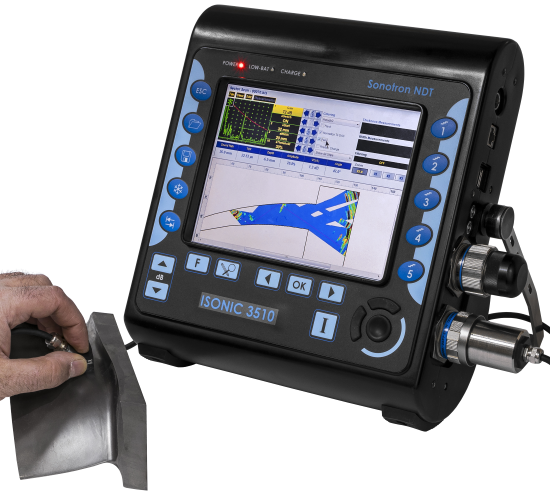
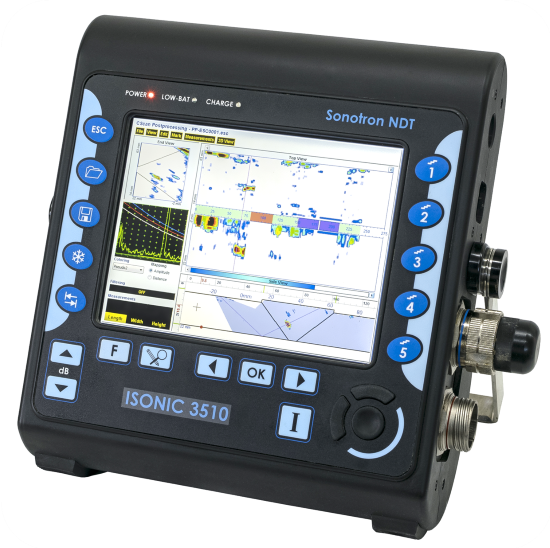
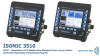
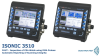
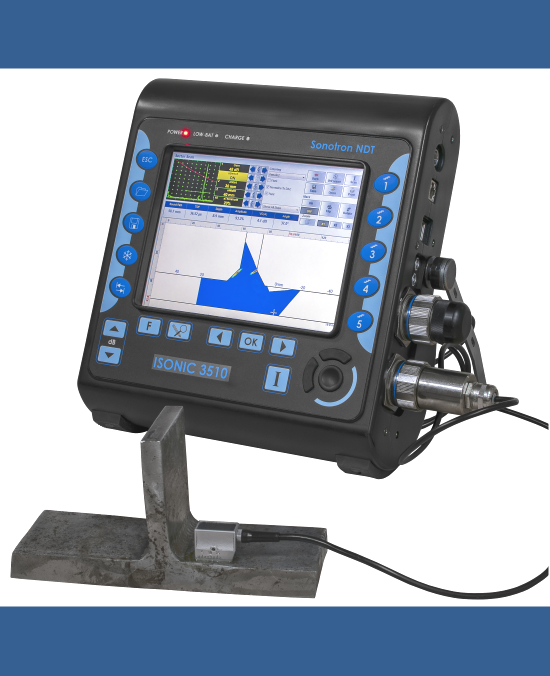
ISONIC 3510T / ISONIC 3510 are packed into the IP 65 reinforced plastic case with no intake air or any other cooling means. The large 800X600 8.5î high brightness (ISONIC 3510) / ultra-high brightness (ISONIC 3510T) screen provides
fine resolution and visibility for all types of inspection data presentation at strong ambient light / direct sunlight along with the optimized power consumption rate for the outdoor operation
ISONIC 3510T / ISONIC 3510 are fully compliant with the following codes
ASME Code Case 2541 ñ Use of Manual Phased Array Ultrasonic Examination Section V
ASME Code Case 2557 ñ Use of Manual Phased Array S-Scan Ultrasonic Examination Section V per Article 4 Section V
ASME Code Case 2558 ñ Use of Manual Phased Array E-Scan Ultrasonic Examination Section V per Article 4 Section V
ASTM 1961ñ 06 ñ Standard Practice for Mechanized Ultrasonic Testing of Girth Welds Using Zonal Discrimination with Focused Search Units
ASME Section I ñ Rules for Construction of Power Boilers
ASME Section VIII, Division 1 ñ Rules for Construction of Pressure Vessels
ASME Section VIII, Division 2 ñ Rules for Construction of Pressure Vessels. Alternative Rules
ASME Section VIII Article KE-3 ñ Examination of Welds and Acceptance Criteria
ASME Code Case 2235 ñ Use of Ultrasonic Examination in Lieu of Radiography
Non-destructive testing of welds ñ Ultrasonic testing ñ Use of automated phased array technology. - International Standard EN ISO 13588:2019
Non-destructive testing of welds ó Ultrasonic testing ó Use of automated phased array technology for thin-walled steel components. - International Standard EN ISO 20601:2018
Non-Destructive Examination of Welded Joints ñ Ultrasonic Examination of Welded Joints. ñ British and European Standard BS EN 1714:1998
Non-Destructive Examination of Welds ñ Ultrasonic Examination ñ Characterization of Indications in Welds. ñ British and European Standard BS EN 1713:1998
Non-destructive Testing
ó Ultrasonic Testing ó Examination for Discontinuities Perpendicular to the Surface. -
International Standard ISO 16826:2012
Calibration and Setting-Up of the Ultrasonic Time of Flight Diffraction (TOFD) Technique for the Detection, Location and Sizing of Flaws. ñ British Standard BS 7706:1993
WI 00121377, Welding ñ Use Of Time-Of-Flight Diffraction Technique (TOFD) For Testing Of Welds. ñ European Committee for Standardization ñ Document # CEN/TC 121/SC 5/WG 2 N 146, issued Feb, 12, 2003
ASTM E 2373 ñ 04 ñ Standard Practice for Use of the Ultrasonic Time of Flight Diffraction (TOFD) Technique
Non-destructive testing of welds - Ultrasonic testing - Use of time-of-flight diffraction technique (TOFD). - International Standard EN ISO 10863:2011
Non-Destructive Testing ñ Ultrasonic Examination ñ Part 5: Characterization and Sizing of Discontinuities. ñ British and European Standard BS EN 583-5:2001
Non-Destructive Testing ñ Ultrasonic Examination ñ Part 2: Sensitivity and Range Setting. ñ British and European Standard BS EN 583-2:2001
AD 2000-Merkblatt HP 5/3 Anlage 1:2015-04: Zerstˆrungsfreie Pr¸fung der Schweiþverbindungen - Verfahrenstechnische Mindestanforderungen f¸r die zerstˆrungsfreien Pr¸fverfahren - Non-destructive testing
of welded joints ñ Minimum technical procedure requirements for non-destructive testing methods (Germany)
The zero point test and annual verification procedures of ISONIC 3510T / ISONIC 3510 are fully compliant with the international standards below and the corresponding national norms
PA channels
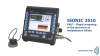
ISO 18563-1. Non-destructive testing ó Characterization and verification of ultrasonic phased array equipment. Part 1: Instruments
ISO 18563-3. Non-destructive testing ó Characterization and verification of ultrasonic phased array equipment. Part 3: Combined systems
Conventional channels
EN 12668-1 / ISO 22232-1. Non-destructive testing ñ Characterization and verification of ultrasonic examination equipment. Part 1: Instruments
EN 12668-3 / ISO 22232-3. Non-destructive testing ñ Characterization and verification of ultrasonic examination equipment. Part 3: Combined Equipment
1 X 32:32 switchable to / from 2 X 16:16
1 X 64:64* switchable to / from 2 X 32:32*
1 X 128:128* switchable to / from 2 X 64:64*
* - with use of the corresponding active PA functionality extension adapters Important: there is no external splitter required in case of using 2 PA probes simultaneously
Initial Pulse:
Bipolar Square Wave with Boosted Rising and Falling Edges, Guaranteed Shell Stability, and Active Damping
Transition:
≤7.5 ns (10-90% for rising edges / 90-10% for falling edges)
1...32/64*/128* adjustable as fully or partially matching OR mismatching with the receiving aperture
* - with use of corresponding active PA functionality extension adapters
Receiving Aperture:
1...32/64*/128* adjustable as fully or partially matching OR mismatching with the emitting aperture
* - with use of corresponding active PA functionality extension adapters
Phasing - emitting and receiving:
0Ö100 μs with 5 ns resolution independently controllable
Analogue Gain:
0...100 dB controllable in 0.5 dB resolution
Advanced Low Noise Design:
85 μV peak to peak input referred to 80 dB gain / 25 MHz bandwidth
Frequency Band:
0.2 Ö 25 MHz
A/D Conversion:
100 MHz 16 bit
Digital Filter:
32-Taps FIR band pass with controllable lower and upper frequency limits; non-linear acoustics technique supported
Superimposing of receiving aperture signals:
On-the-fly, no multiplexing involved
Phasing (receiving aperture):
On-the-fly 0Ö100 μs with 5 ns resolution
Dynamic Focusing:
Supported
FMC, TFM, Back Diffraction Technique with / without and Mode Conversion:
Supported
A-Scan:
RF
Rectified (Full Wave / Negative or Positive Half Wave)
Signal's Spectrum (FFT Graph)
Reject:
0...99 % of screen height controllable in 1% resolution
Material Ultrasound Velocity:
300...20000 m/s (11.81Ö787.4 "/ms) controllable in 1 m/s (0.1 "/ms) resolution
Time Base - Range:
0.5...7000 μs - controllable in 0.01 μs resolution
Time Base - Display Delay:
0...400 μs - controllable in 0.01 μs resolution
Probe Delay:
Automatically settled depending on the PA probe / wedge / delay line in use according to the desired:
Aperture(s)
Incidence Angle
Focal Point Position
etc
DAC / TCG:
One Per Focal Law
Multi-curve
Slope ≤ 46 dB/μs
Available for the rectified and RF A-Scans
Theoretical ñ through entering dB/mm (dB/") factor
Experimental ñ through recording echoes from several reflectors; capacity - up to 40 points
Automatic Gain Correction:
Complimentary Mechanism Independent on DAC / TCG:
AGC - Angle Gain Compensation for the sectorial scan coverage
GPSC - Gain Shot (Focal Law) Correction for other types of coverage
EquPAS - Equalized (Homogenized) PA Inspection Sensitivity:
Provided for every desired type of reference reflector:
SDH (Side Drilled Hole)
FBH (Flat Bottom Hole)
EDM Notch
etc
Gates:
2 Independent gates per focal law (A and B) with the Start / Width controllable over entire time base in 0.1 mm /// 0.001" resolution
IE gate per focal law for the standard Interface Echo start function controllable over entire time base in 0.1 mm /// 0.001" resolution
Threshold:
5Ö95 % of A-Scan height controllable in 1 % resolution
Phased Array Probes:
1D Array ñ linear (LA), rings (RA), daisy (DA), and the like
Dual Linear Array (DLA)
Matrix Array (MA)
Dual Matrix Array (DMA)
Focal Laws:
8192 in total
Independently adjustable gain / time base / apertures / pulsing receiving modes / focal point positions, etc for each focal law among the plurality of implemented within a frame composing sequence
On-the-fly focal law editing ability
Dynamic focusing ñ according to the desired scan plan:
for any set of points distributed within entire cross-section of the material covered by linear array probe / group of probes and forming either straight, curved, zigzag, or broken line
for any set of points distributed inside 3D space within entire cube or other volumetric polygon of the material covered by matrix array probe / group of probes and forming either plane or curved surface of several surfaces
Multi-axis / multi-plane / multi-frame video stream augmented reality encoder for free-hand
manual and mechanized probe manipulation with encoding of X,Y,Z probe coordinates and
a, b, g
swiveling / skewing angles in 3 orthogonal planes on flat and complex surfaces
Remote Control:
From an external computer running under W'XP, W'7, W'8, W'10, W'11 through Ethernet or Wi Fi
From 3,4,5G Cell Phone
No special software required
All calibration and inspection data is stored in the control computer
Ambient Temperature:
-30∞C ... +60∞C (operation)
-50∞C ... +60∞C (storage)
Housing:
Rugged reinforced plastic case with the stainless steel carrying handle / MIL-STD-810H 516,8 applicable tests passed
IP 65
No air intake
The cooling is not required
Available in black and red color (on demand)
Dimensions:
292x295x115 mm (11.50"x11.61"x4.53") - with / without battery inside
Weight:
4,850 kg (10.70 lbs) ñ with battery 4.200 kg (9.26 lbs) ñ without battery
Phased Array Pulser Receiver
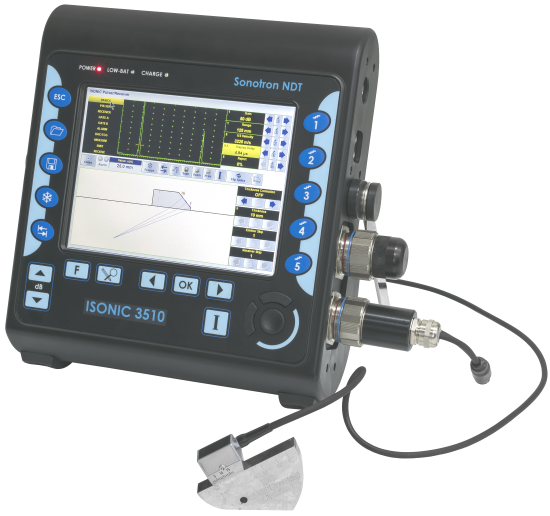
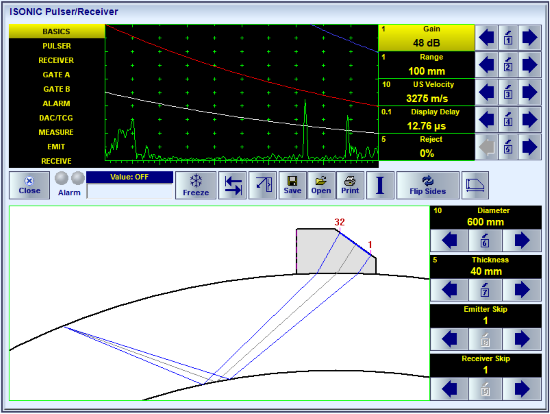
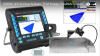
In the ISONIC 3510T / ISONIC 3510 PA Pulser Receiver is controlled through the intuitive operating surface combining classiic user interface of ultrasonic flaw detector and the ray-tracing graphics
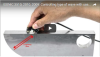
Types of waves to be generated in / received from the material are controlled / selected through entering the value of the corresponding ultrasonic velocity in the material. The videos below
illustrate control of the type of wave emitted into material either longitudinal or shear with the use of wedged linear array probe (the wedge angle of 36∞exceeds the first critical angle):
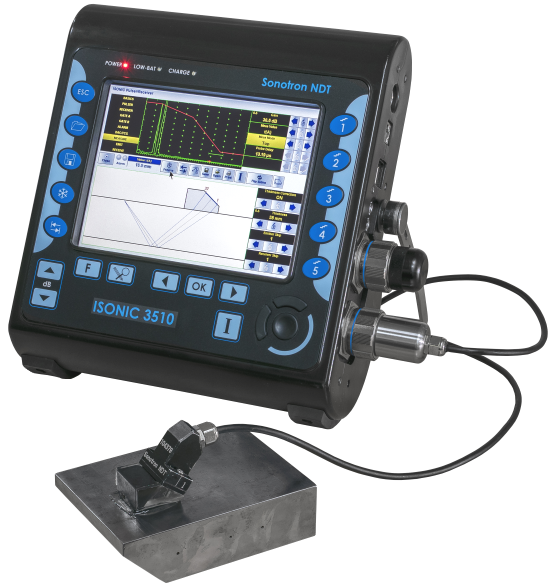
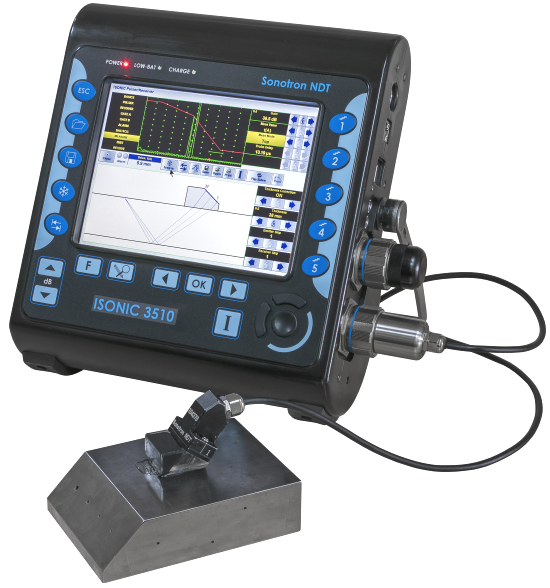
The trace of ultrasonic beam, probe footprint, focal points, apertures, etc are truly imaged upon entering thickness, OD, and other data characterizing geometry of the material
Whilst performing inspection with the use of wedged linear array probes according to the S-, B-, or other scan plan it is possible to add a number of additional focal laws to the main sequence.
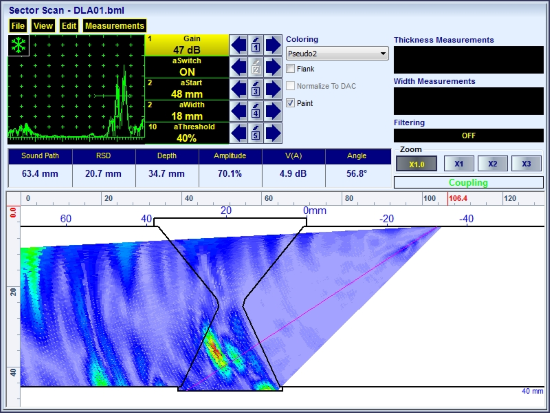
The calibration for each such focal law is performed through the Phased Array Pulser Receiver dialogue. The instrument screen video below illustrates activation of 0-deg compression wave pulsing-receiving
focal law in order to monitor coupling between the probe and material through evaluation of the back wall echo amplitude (the same focal law allows detection of laminations in the parent material under
the probe at the same time):
Signal presentation and evaluation for the A-Scans obtained through implementing of the desired focal laws is fully compliant with the conventional UT codes and procedures
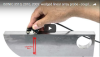
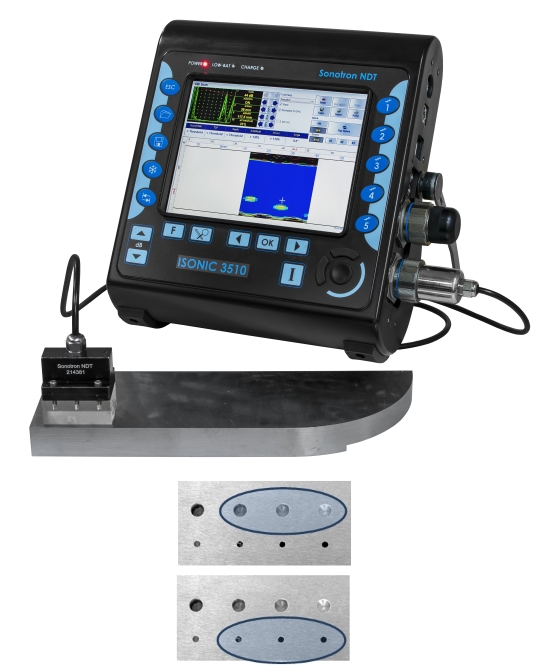
DAC and TCG may be created through collecting echo amplitude / time of flight data from up to 40 reflectors (points) or through entering dB/mm (dB/inch) factor. The photos and
video below illustrate the use of the typical calibration block for creating a DAC through collection of shear wave echoes from the Flat Bottom Hole (FBH) obtained through the half-, full-, 1.5 skip insonification:
The videos below illustrate preparing DAC for other reference reflectors, namely, the EDM Notch and the Side Drilled Hole (SDH), commonly used for the shear wave inspection:
The video below illustrates preparing DAC for the compression wave inspection with the use of FBH reference reflector:
The above allows using of the same concepts and calibration blocks as for conventional UT and extremely simplifies calibration of the instrument prior to the electronic scanning
Note: In order to accelerate the data stream the videos above are linked to the Youtube. In case the YouTube may not be accessed from your location please use the links below
B-Scan / S-Scan
Cross-sectional insonification and imaging of the material may be provided electronically with use of linear array probes through:
Linear scanning with ultrasonic beam at predetermined incidence angle through reallocating of fixed size emitting/receiving aperture within entire array and composing of B-Scan image
Sectorial scanning with ultrasonic beam produced by fixed emitting/receiving aperture through steering of incidence angle in the predetermined range and composing of S-Scan image
Combining linear and sectorial scanning
etc
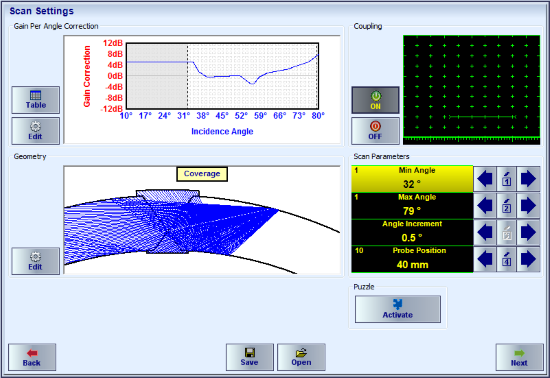
The effects of inequality of elements of linear array, varying sound path and loss in the delay line or wedge, dependency of energy of refracted wave and effective size of emitting/receiving aperture
on incidence angle should be compensated to equalize the sensitivity over insonified cross-section. The unique feature of ISONIC 3510T / ISONIC 3510 is the ability of managing independently adjustable focal laws
within the same frame-composing sequence of pulsing/receiving shots so every focal law may me executed with individually adjusted gain, time base, and other core settings providing:
Gain per Shot Correction for B-Scan
Angle Gain Compensation for S-Scan
True-to-Geometry imaging representing actual distribution of ultrasonic beams and true-to-location indication of defects in the cross-sectional view of the material
Several examples below illustrate the superior performance of ISONIC 3510T / ISONIC 3510 proven on the most commonly used simple reference blocks. The instrument files for each example are downloadable and may be played back using the freely distributable ISONIC PA Office software package
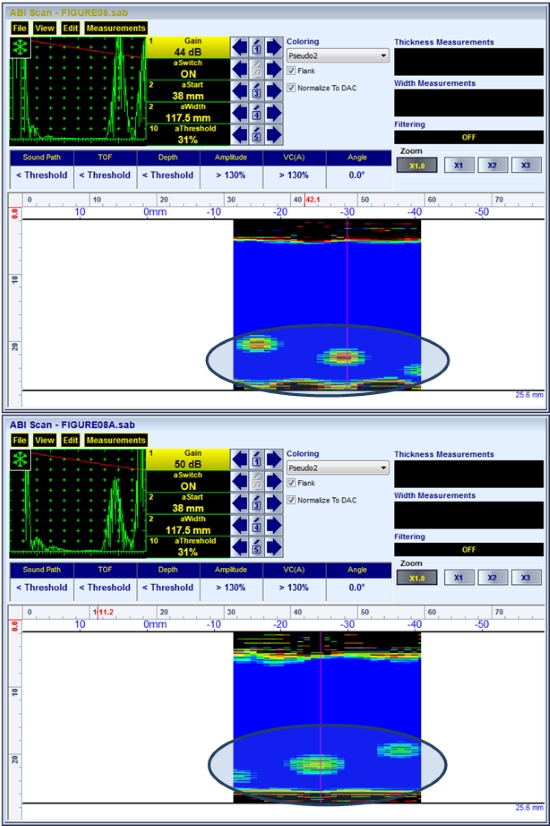
Example 1: Two compression wave B-Scan images of three flat bottom holes. The corresponding instrument file # 1 and instrument file # 2 are available for download and playing with use of ISONIC PA Office Software package
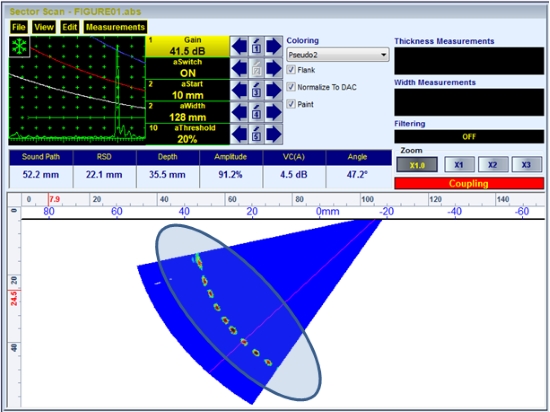
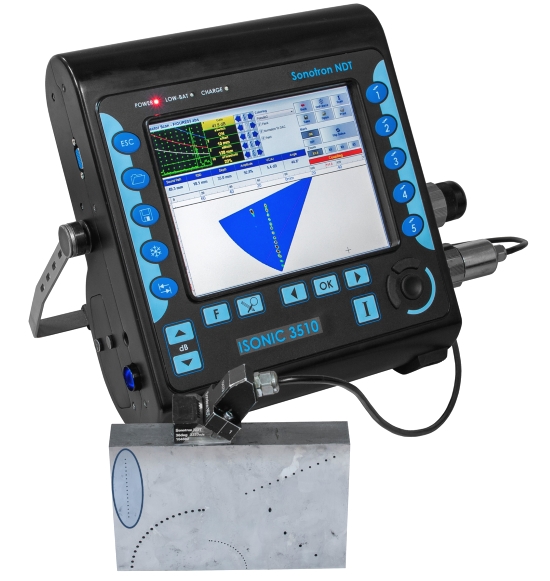
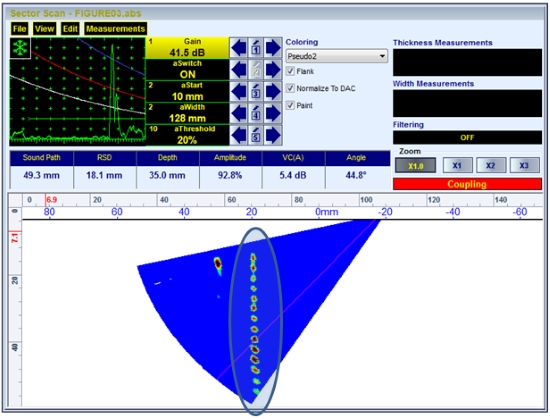
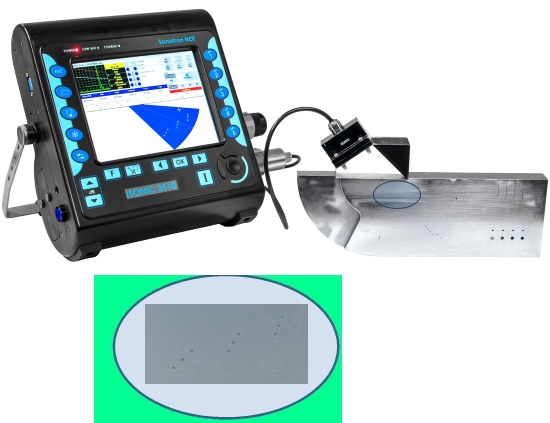
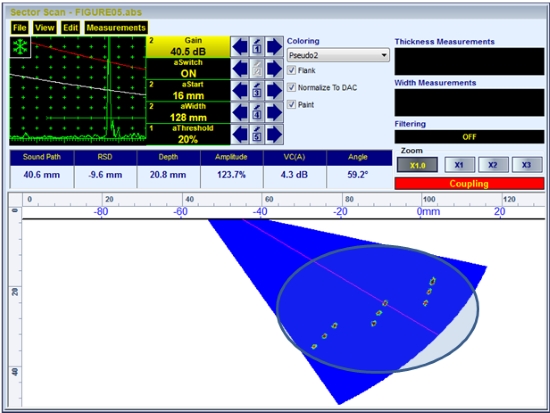
Example 2: Shear wave S-Scan image of several side-drilled holes forming 50 mm radius arc in the material. The corresponding instrument file is available for the download and playing with use of ISONIC PA Office Software package
Example 3: Shear wave S-Scan image of several side-drilled holes forming 25 mm radius arc in the material. The corresponding instrument file is available for the download and playing with use of ISONIC PA Office Software package
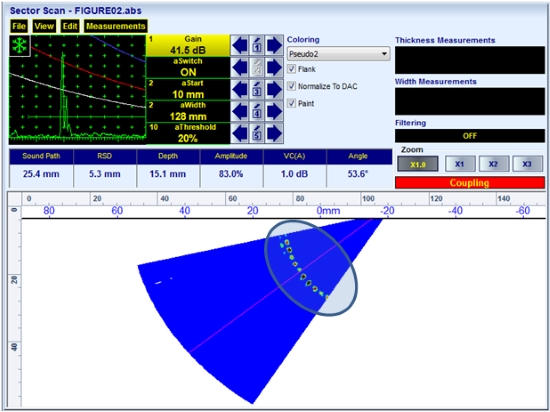
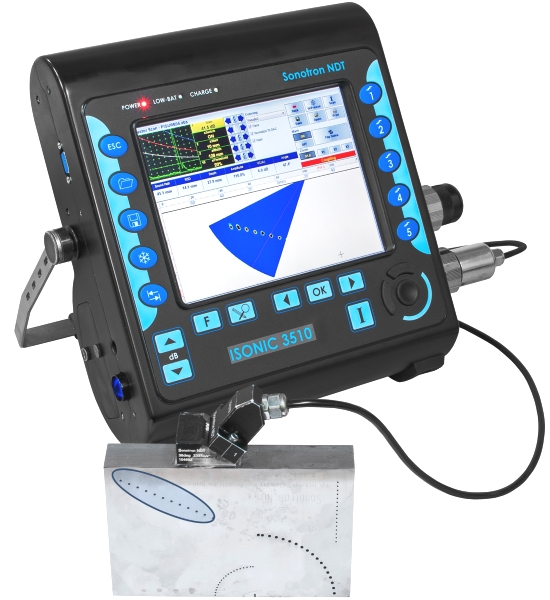
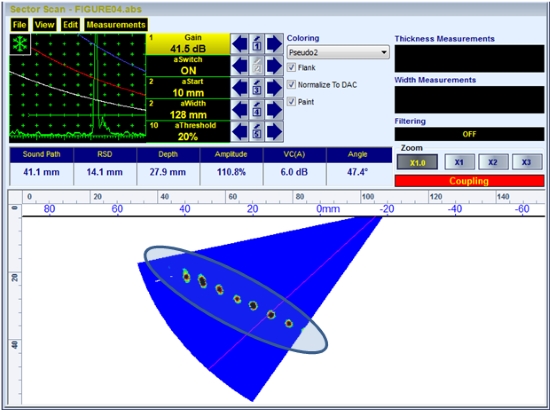
Example 4: Shear wave S-Scan image of several side-drilled holes forming straight vertical line in the material. The corresponding instrument file is available for the download and playing with use of ISONIC PA Office Software package
Example 5: Shear wave S-Scan image of several side-drilled holes forming straight line in the material. The corresponding instrument file is available for the download and playing with use of ISONIC PA Office Software package
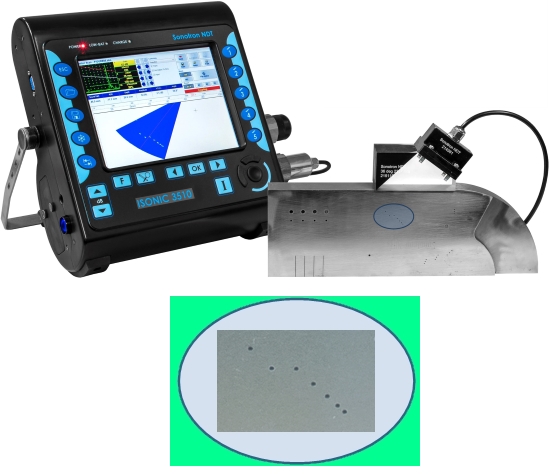
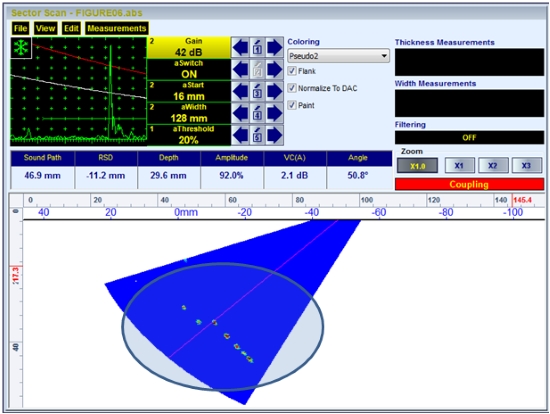
Example 6: Shear wave S-Scan image of nine side-drilled holes forming 3 short straight lines in the material. The corresponding instrument file is available for the download and playing with use of ISONIC PA Office Software package
Example 7: Shear wave S-Scan image of seven side-drilled holes forming Z-chain in the material. The corresponding instrument file is available for the download and playing with use of ISONIC PA Office Software package
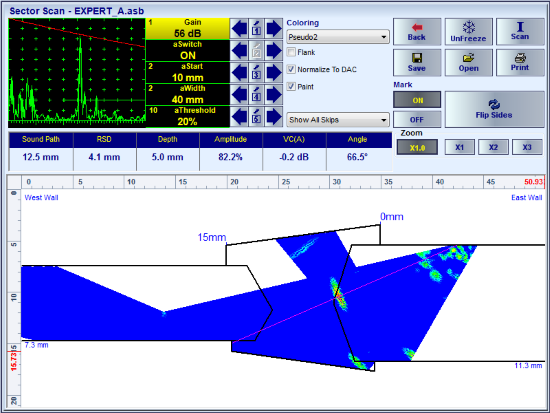
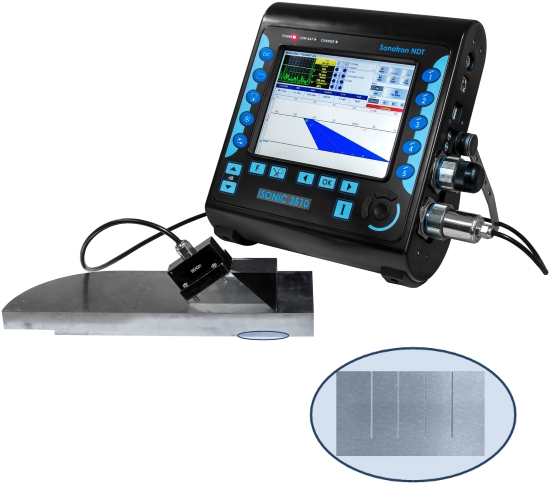
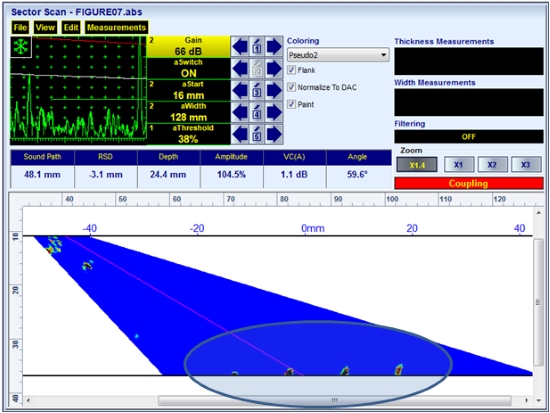
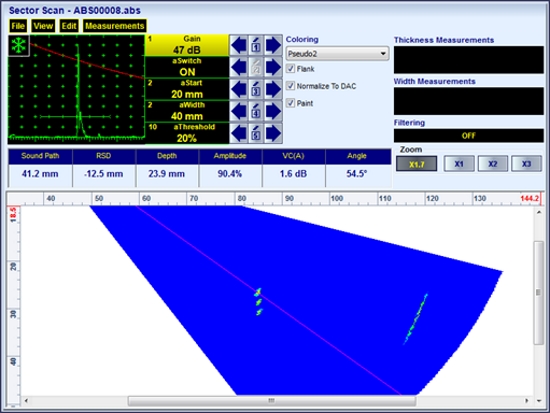
Example 8:True-to-Geometry shear wave S-Scan image of four notches on the bottom surface of the material. The corresponding instrument file is available for the download and playing with use of ISONIC PA Office Software package
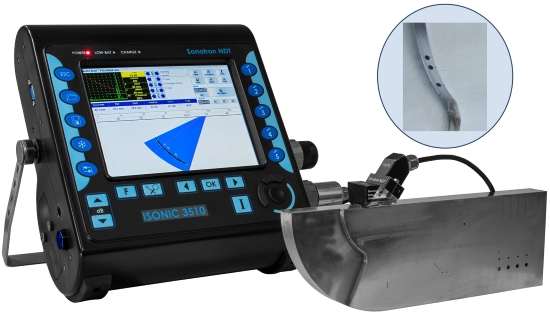
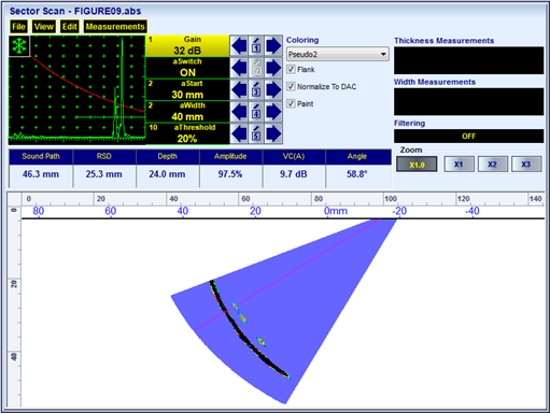
Example 9: Shear wave S-Scan image of three flat bottom holes made from the cylyndrical outer surface of the material. The corresponding instrument file is available for the download and playing with use of ISONIC PA Office Software package
Example 10: Shear wave S-Scan image of three side-drilled holes forming a vertical line and the inclined step in the material behind the holes. The corresponding instrument file is available for the download and playing with use of ISONIC PA Office Software package
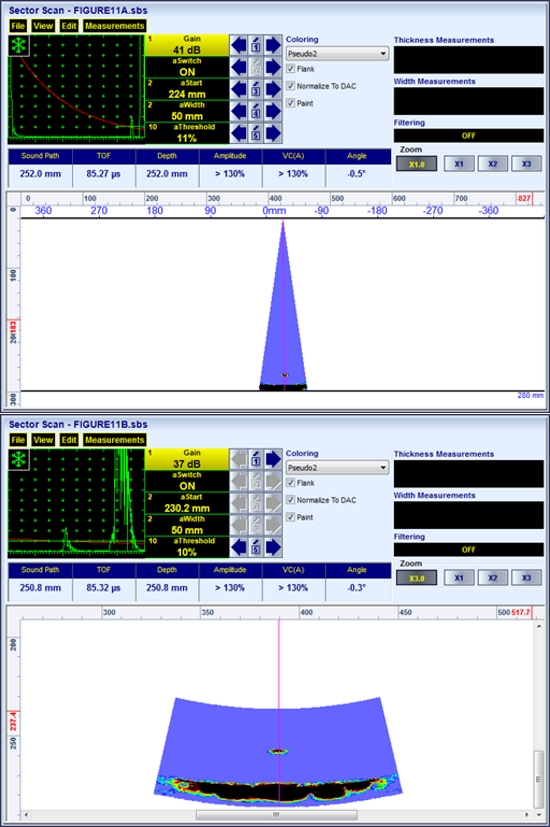
Example 11: Compression wave S-Scan image of the 1.2 mm flat bottom hole at ~251 mm depth in the ALCOA block and the back surface of the said block. The corresponding instrument file # 1 and instrument file # 2 are available for the download and playing with use of ISONIC PA Office Software package
Ultrasonic Spectroscopy: Frequency Domain - PA Modality
Whilst implemented either in pulse-echo or pitch-catch mode the Ultrasonic Spectroscopy (uSpectroscopy) is based on the analysis of the frequency spectrum of the pulses passed through the material. The frequency spectrum of the ultrasonic signals
is measured and evaluated in addition to their time-of-flight and amplitude
uSpectroscopy may be implemented by digital ultrasonic flaw detector either phased array (PA) or conventional featured with the function of Fast Fourier Transform (FFT) converting the stream of digital data representing the digitized ultrasonic signal
(Time Domain) into the Spectrum data array reflecting the distribution of the signal energy by frequencies (Frequency Domain)
Every portable Sonotron NDT instrument such us ISONIC 3510T / ISONIC 3510, ISONIC 2010, and ISONIC 2009 UPA Scope as wells as the high speed automatic
PA inspection platform ISONIC PA AUT is featured with the FFT function for both the PA and the conventional modality. The FFT function is applicable to every focal lawís A-Scan obtained at the
calibration, inspection, and evaluation stage bringing the speed and the reliability of the material characterization to the significantly higher level. For every FFT graph or a part of it the signalís center frequency and the bandpass
at the desired level are determined automatically and indicated
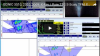
The video below illustrates the principles of forming and imaging of the FD B-Scan (Frequency Doman B-Scan) based on the typical application example related to the inspection of honeycomb panel with composite skin. The FFT function is
applied to each back wall echo out of the sequence of signals received over entire PA probe coverage providing clear pitch-size-resolution distinguishing between the different quality areas
Use of the FD B-Scan for the detection of impact damages of the internal structure of CFRP panels
Another inspection application that may be easy resolved using the FD B-Scan coverage relates to the detection of the lack of sealing / bonding materail under the aluminum skin patch in the aircraft
The next video represents the PA Probe connected to the standard delay line, the front surface of which is free. The FFT is applied to every echo obtained through the reflection from the front surface of delay line whilst the firing / receiving aperture
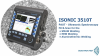
consists of one element only: in such manner each element of the probe is verified rapidly by the echo amplitude, waveform, and frequency domain so the PA Probe verification document may be issued automatically in less than a minute since the PA probeís
terminal is plugged in; the results of verification become compatible with the similar analysis performed for conventional probes
The PA probe verification report may be generated in a click then:
The videos below illustrate the rapid screening of the metal structure relating to the evaluation of the tempering quality. The same approach is applicable to the HTHA checking using compression and shear waves, casting nodularity
inspection, distinguishing between the weld and parent metal, and the like:
Note: In order to accelerate the data stream the videos above are linked to the Youtube. In case the YouTube may not be accessed from your location please use the links below
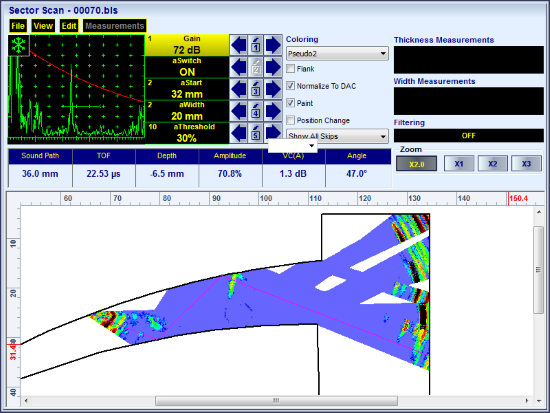
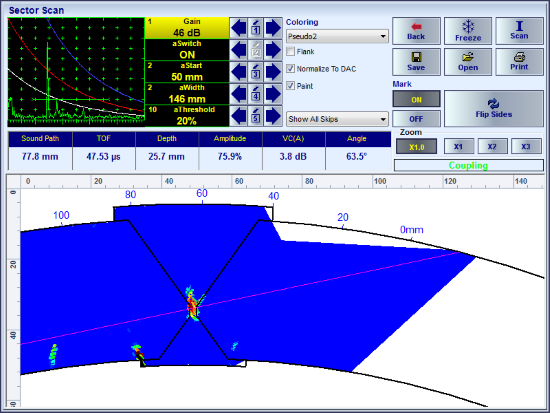
True-to-Geometry Coverage and Imaging
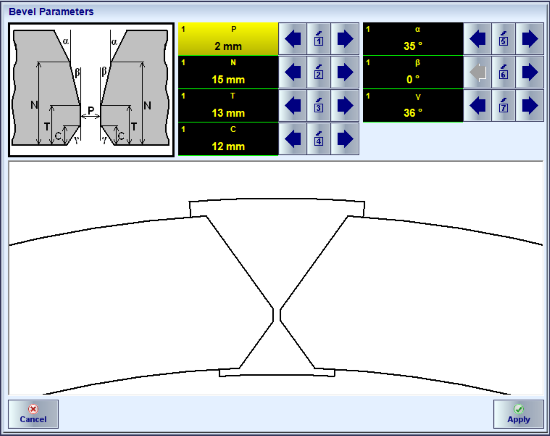
True-to-Geometry Coverage and Imaging is the unique proprietary technology of Sonotron NDT, which is explained below based on an example related to the inspection of longitudinal weld
True-to-Geometry Coverage and Imaging Technology is based on the following principles:
the actual outer shape and dimensions of the material are entered into the instrument along with the important internal structure particulars and represented on the screen as the dimensioned drawing (sketch)
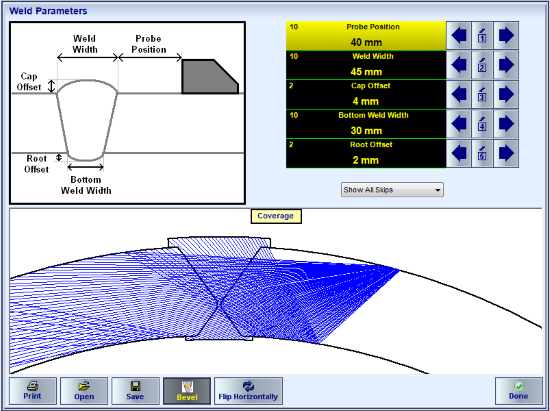
the image guided ultrasonic beam-tracing is performed by an operator over the said drawing through varying probe position on the scanning surface and manipulating beam coverage parameters virtually until the optimal scan plan is achieved
the needful calibration of ultrasonic PA pulser receiver and the correction settings corresponding to the designed scan plan are performed then with use of the appropriate calibration blocks
at last the sequence of focal laws providing the desired ultrasonic coverage of the material at the given placement of PA probe is formed; every focal law is characterized by the individually adjusted incidence angle, time base, gain, and DAC
the bulks of A-Scans representing every implemented focal law from the plurality defined by the scan plan are pushed into the focal law memory of the instrument and the image is composed in real time indicating the reflectors in their actual positions
independently on the combination of beams providing their detection
The main advantages of the True-to-Geometry Coverage and Imaging vs regular sectorial / linear scan coverage are:
extremely simple and quick on-the-spot interpretation of the observations and inspection results
distinguishiung of the geometry echoes and accompanying effects avoiding the influence of the irrelevant signals to the data interpretation
The said advantages are illustrated by the videos below illustrating inspection of in the butt weld with symmetrical and asymmetrical bevel and in the fillet weld
Note: In order to accelerate the data stream the videos above are linked to the Youtube. In case the YouTube may not be accessed from your location please use the links below
EquPAS ñ the Equalized (Homogenized) PAUT Sensitivity approach is applicable for the inspections implemented by all portable and automatic ultrasonic PA flaw detectors and systems of Sonotron NDTís
ISONIC series (ISONIC 3510T / ISONIC 3510, ISONIC 2010, ISONIC 2009 UPA Scope, ISONIC PA AUT)
covering the welds and parent material of all types and shapes, shafts and axles, raw materials (forging and casting), composites, etc tested with the use of linear, matrix and other types of PA probes
The EquPAS approach resolves the issue of inhomogeneous sensitivity over cross-section or volume of the material covered through implementing of the desired scan plan (either sectorial, linear, tandem, or 3D) by PA probe in
each position over the scanning trace. Prior to the inspection the instrumentís PA pulser receiver is calibrated in the same manner as the regular conventional ultrasonic flaw detector for one focal law selected from the plurality
to be implemented within the entire scan plan. Whilst implementing the sequence of pulsing receiving cycles following the scan plan each focal law is characterized by the individually settled focal point and time base; the sensitivity
is equalized within entire insonified section of the material through use of the independent mechanisms of Angle Gain Compensation (AGC, sectorial scan) or Gain per Shot Correction (GSC, linear, tandem, or 3D scan) and DAC/TCG acting
simultaneously thanks to the unique ability of ISONIC Series PA instruments: the DAC / TCG mechanism is used purely for compensating the dependency of echo amplitude on the material travel distance while the feature of
varying Gain per Focal Law voluntarily is utilized just for the forming of easy-reproducible AGC (or GSC) plan. Both the DAC / TCG and AGC (or GSC) plans are created with use of the same set of reference reflectors. The color
palette used for the imaging represents dB-to-DAC (TCG inactive) or the echo height (TCG active) value for each signal. As a result the same defect will be represented with the same color and evaluated accordingly independently
on itís position in the insonified cross-section or volume of the material
The video below illustrates the principles of EquPAS solution:
The video below illustrates the examples of EquPAS approach applied to the shear wave S-Scan cross-sectional coverage with the use of most common reference reflectors (Flat Bottom Hole - FBH, EDM Notch, and Side Drilled Hole - SDH) for the
sensitivity calibration
The shorter videos illustrating working out the shear wave AGC for FBH, EDM Notch, and SDH followed by justifying the calibration are below:
At last two videos below illustrate the EquPAS approach applied to the compression wave S-Scan cross-sectional coverage with the use of FBH and SDH reference reflectors for the
sensitivity calibration
Note: In order to accelerate the data stream the videos above are linked to the Youtube. In case the YouTube may not be accessed from your location please use the links below
FMC/TFM: Full Matrix Capture / Total Focusing Method for the
Data Acquisition, Processing and Imaging
Thanks to the fully parallel architecture the FMC/TFM protocols of data acquisition, processing and imaging are implementable in the ISONIC 3510T / ISONIC 3510 instrument as well as in other ISONIC Series portable PA instruments such as
ISONIC 2010, ISONIC 2009 UPA-Scope.The FMC/TFM protocol is the standard feature for all suitable modes of operation
The exemplary videos below illustrate the unique ability of ISONIC series PA instruments allowing the on-line toggling between true-to-geometry (true-to-shape) sectorial scan coverage and imaging and FMC/TFM imaging for the inspection of:
butt welds
fillet welds
compression wave inspection of metals
It is important that ISONIC 3510T / ISONIC 3510 instruments are featured with 100% raw data storage for all inspections performed: for every focal law implemented with the use of some coverage
strategy, such as S-Scan, Linear Scan, etc or a combination of them the resulting A-Scan is formed as an outcome of superimposing with the corresponding phase shifts of
several of primary A-Scans produced by each element of the receiving aperture. As the primary A-Scans are stored into the raw data matrix the TFM image may be reconstructed
from the files created at any time in past using either S-Scan, Linear Scan coverage, etc or a combination of them:
The exemplary videos below illustrate the reconstruction of TFM image from the pure S-Scan files, which were obtained with no angle gain compensation and DAC (or TCG) normalization,
and comparison of TFM images with the EquPAS S-Scan coverage results: the EquPAS approach (Equalized Phased Array Inspection Sensitivity) is based on
the simultaneous use of two independent mechanisms equalizing the inspection sensitivity over entire insonified part of the material, namely Angle Gain Compensation and DAC (TCG) normalization.
All compared results were obtained with the same probe situated at the same position on the material:
As it is clear from the videos the TFM protocol and EquPAS S-Scan improve the coverage and sharpness of ultrasonic imaging significantly comparing to the pure S-Scan. The
detectability and imaging of the planar reflectors, whichís echo amplitudes strongly depend on the insonification direction have been improved very significantly as well
On the other hand comparing to FMC/TFM the EquPAS S-Scan allows using of smaller footprint probes; moreover the significantly less number of focal laws (pulsing/receiving cycles)
should be implemented in order to cover the same portion of the material so generally speaking the EquPAS S-Scan coverage allows scanning with the higher speed requiring the smaller area to be cleaned on the
surface of the material prior to the probe manipulation
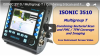
Inspection SW application MULTIGROUP T for the portable PA instruments and platforms of ISONIC Series
(ISONIC 3510T / ISONIC 3510 ñ all units, ISONIC 2010 units manufactured after April 30, 2017, ISONIC 2009 UPA-Scope units manufactured after May 31, 2017,
and ISONIC PA AUT units manufactured after March 1, 2018) for the first time ever provides performing of the regular or true-to-geometry Sectorial Scan (S-Scan) coverage with / without
involvement of cross-sectional sensitivity equalizing (EquPAS) along with the FMC/TFM coverage for the simple and complex geometry welds and other structural elements. The instrument screen video illustrating
the live S-Scan and FMC/TFM coverage and imaging is present below:
Availability of both complimentary approaches, namely FMC/TFM and EquPAS, in the same instrument allows the inspection organizations finding the optimal solutions for their daily practice
Note: In order to accelerate the data stream the videos above are linked to the Youtube. In case the YouTube may not be accessed from your location please use the links below
MULTIGROUP, MULTIGROUP T, MULTIGROUP D
MULTIGROUP, MULTIGROUP T modes of operation allow implementing of several different scan plans (up to 5) simultaneously out of the same wedged linear array probe increasing the probability of detection and precision of
the defects evaluation
MULTIGROUP D mode of operation allows implementing of several different scan plans (up to 4) simultaneously
out of the same linear array probe probe with Delay Line increasing the probability of detection and precision of the defects evaluation
Note: In order to accelerate the data stream the video above is linked to the Youtube. In case the YouTube may not be accessed from your location please use the links below
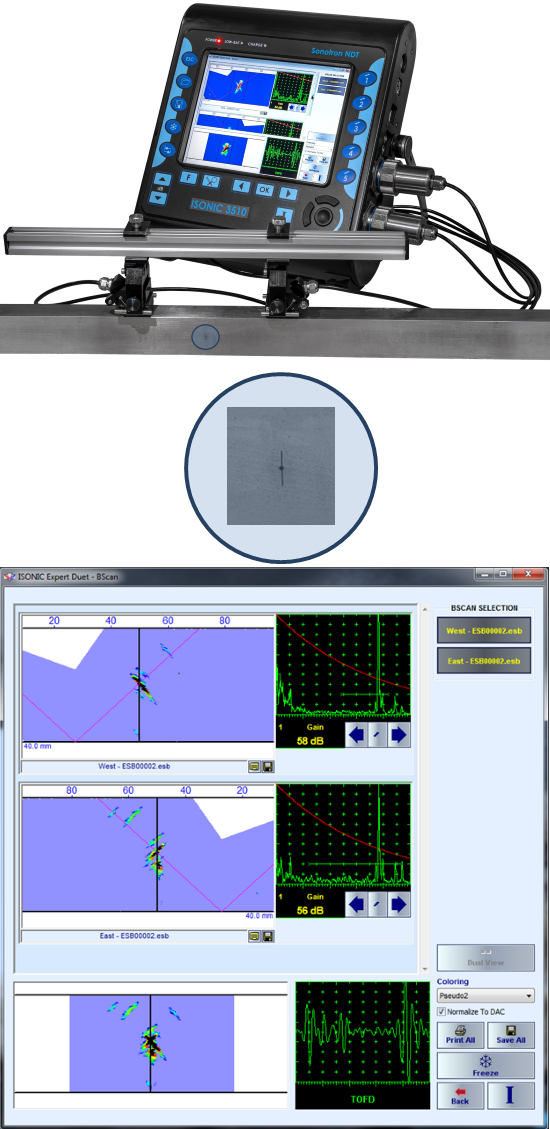
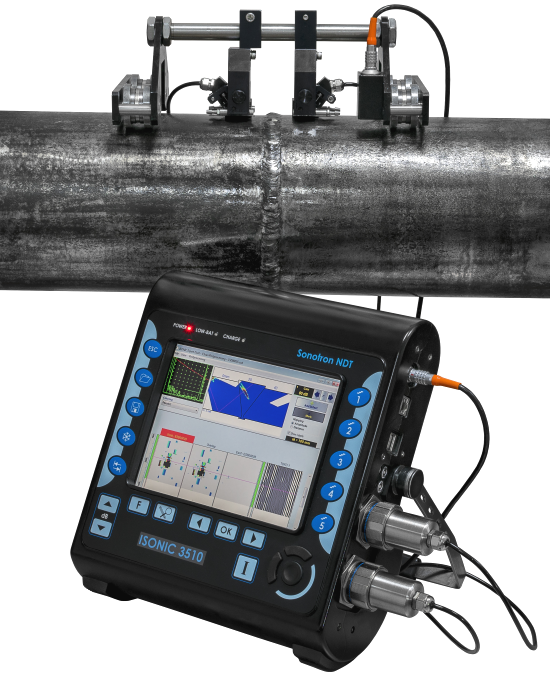
ISONIC DUET Technology
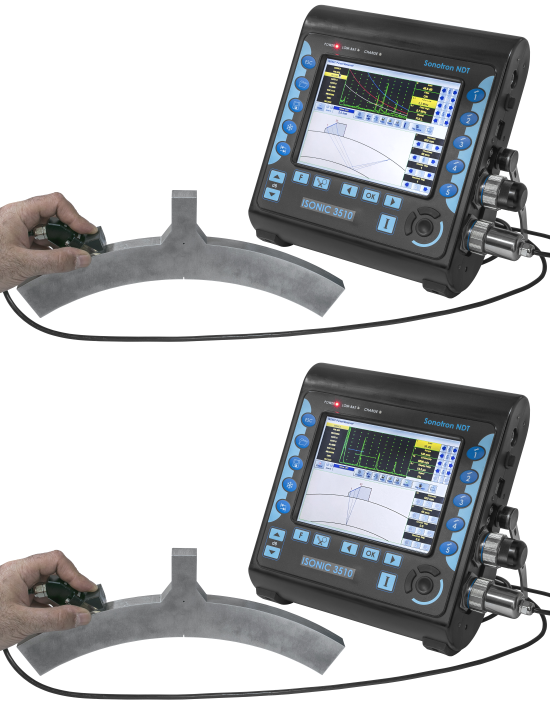
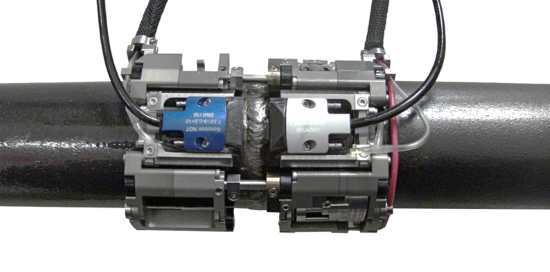
ISONIC 3510T / ISONIC 3510 instruments allow implementing of the highly demanded DUET and DUET_M applications
related to the inspection of butt (planar and circumferential) and longitudinal welds from both sides simultaneously with use of a pair of PA probes carrying up to 16 elements each.
Use of 2 probes carrying more than 16 elements (up to 32 or 64) each is also possible provided the corresponding extension terminals are involved
There is no external splitter required for the connecting of 2 PA probes to ISONIC 3510T / ISONIC 3510
The welds inspected with use of the ISONIC DUET Technology may have either symmetrical or asymmetrical bevel
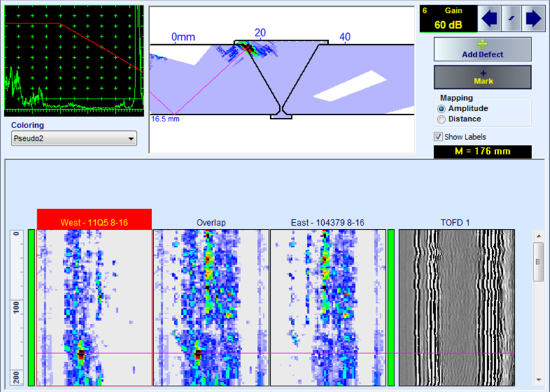
True to geometry coverage and imaging of the weld & HAZ volume is provided for each PA probe separately and in the overlap; each PA probe may implement a number of insonification schemes simultaneously (2 X MULTIGROUP mode)
For the first time ever the complimentary TOFD inspection with forming of up to 4 separate shots (depending on the material thickness) may be performed out of the same pair of PA probes:
This novel way of implementing TOFD shots extremely simplifies and lightens the structure of the scanning frame and it is already recognized by the international standard EN ISO 13588:2012 and a number of other national and industry codes;
alternatively the use of 1 or 2 additional pairs of regular TOFD probes connected to the conventional channels is possible
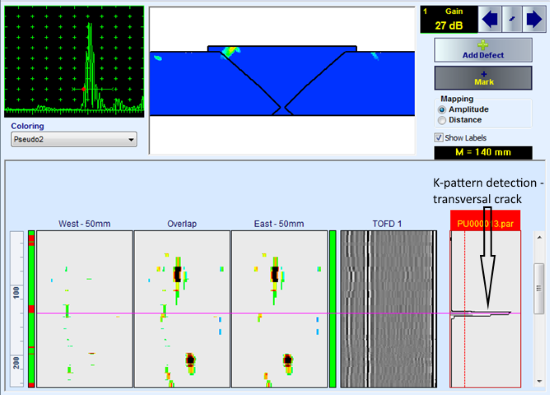
It is also provided the ability of simultaneous K-Pattern pitch-catch detection of the transversal cracks with use of conventional shear wave probes
Whilst scanning the weld from both sides along the fusion line the instrument performs:
100% raw data capturing
True-to-geometry cross-sectional imaging for each probe separately and in the overlap
Generating of the corresponding strip chart representing top view of the weld and HAZ
Coupling with the material is monitored for each PA probe separately and recorded into the corresponding strips
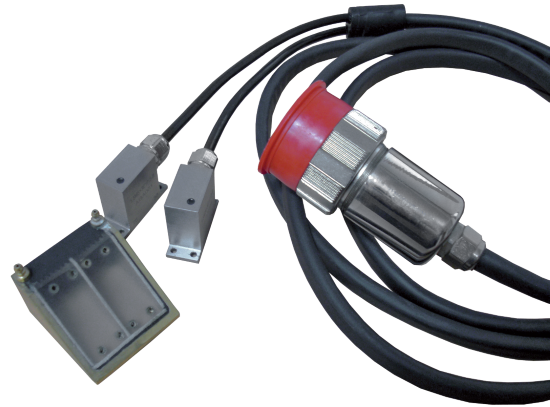
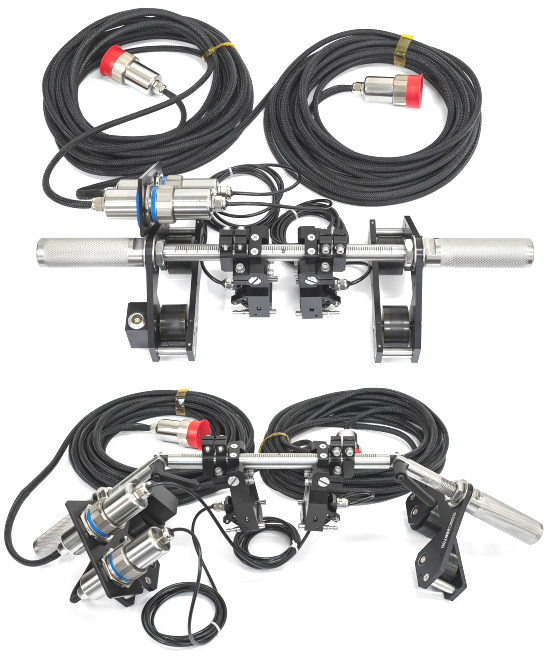
There is a number of scanners available for implementing of scanning with a pair of PA probes, such as, for example:
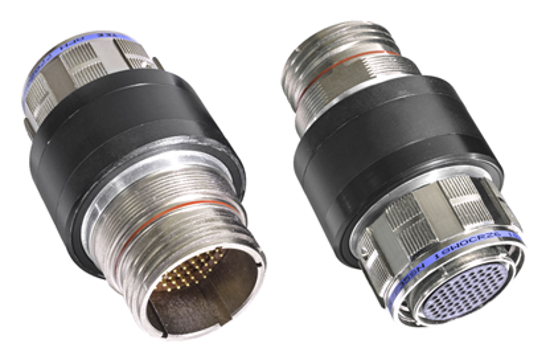
In order to prevent the quick damage of the cables of the PA probe carried by the scanner there are various extenders available,
which are connected to the instrument's PA probe terminals at one end and fitted into the scanner frame at the other so the PA probes cables are kept connected reliably
Note: In order to accelerate the data stream the video above is linked to the Youtube. In case the YouTube may not be accessed from your location please use the link below
Versatile Fully Parallel PA Functionality Out of the Same Unit - from 2 X 16:16 and 1 X 32:32 to 2 X 64:64 and 1 X 128:128
Fully parallel 1 X 64:64 functionality of ISONIC 3510T / ISONIC 3510 may be provided with the use of one S 4922A064D032 active functionality extension adapter connected
to the "W" PA probe terminal. The use of two said adapters provides fully parallel 2 X 32:32 functionality
The video below illustrates all possible options for extension of fully parallel PA functionality and exemplary compression wave 0-deg B-Scan coverage using 128-elements linear array probe
For the given pitch size the use of the adapter S 4922A064D032 / S 4922A064D016 with the delay line corresponding linear array probes doubles / quadruples the width coverage in the material for the straight beam compression wave applications, such as flaw detection, corrosion mapping,
inspection of composite panels for laminations, etc
For the wedged linear array probes the extension adapters S 4922A064D032 / S 4922A064D016 allow doubling / quadrupling the size of the active aperture providing the sharp focusing and imaging while inspecting heavy thickness materials
In case of using wedged linear array probes the extender allows doubling the size of the active aperture providing the sharp focusing and imaging while inspecting heavy thickness materials:
The videos below illustrate veryfying of the fully parallel PA functionality whilst using the PA functionality extension adapters:
The video below illustrates the scanning over the metallic calibration block with the use of 64-elements linear array probe connected to the 32:32 instrument through the extender providing 64:64 functionality
The video below shows utilizing full aperture of 64-elements of the wedged linear array probe connected to the 32:32 instrument through the extender providing 64:64 functionality allowing achieving of the highest resolution
whilst performing S-Scan coverage of the heavy thickness (200 mm) material
Note: In order to accelerate the data stream the videos above are linked to the Youtube. In case the YouTube may not be accessed from your location please use the link below
Tandem B-Scan
ISONIC 3510T / ISONIC 3510 is featured with the unique Tandem-B-Scan cross-sectional coverage and imaging technique providing
the rapid reliable detection of the vertical and close to vertical planar defects in the welds, plates, tubes and vessels walls, rails, and the like is provided. 64-elements wedged linear array probe and
S 4922A064D016 active functionality extension adapter are required for the implementation in compliance with international
standard
ISO 16826:2012
The video below illustrates the principles of forming focal laws and providing Tandem B-Scan screening of the material:
ISONIC 3510T / ISONIC 3510 allow composing and implementing a group of tandem focal laws a strip chart - this mode of operation allows quick line-scanning of the narrow gap welds with zonal discrimination, butt welds in HDPE pipes, etc
as it is illustrated by the videos below:
Note: In order to accelerate the data stream the videos above are linked to the Youtube. In case the YouTube may not be accessed from your location please use the link below
DOWNLOAD AND PLAYBACK THE EXEMPLARY INSTRUMENTS FILES:
On completing the download the files should be extracted from the archive and played in the regular PC running under Win'XP, 7, 8, 10, 11 with use of the freely distributable ISONIC PA Office software package
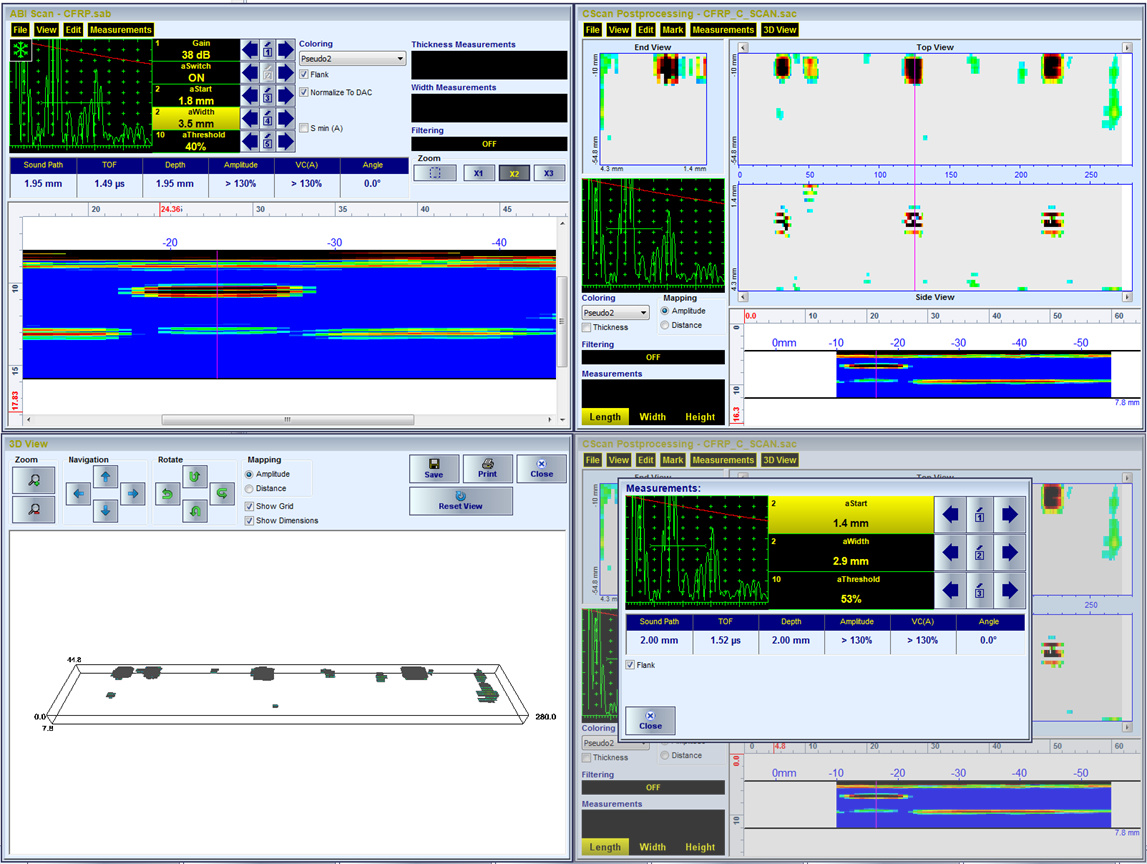
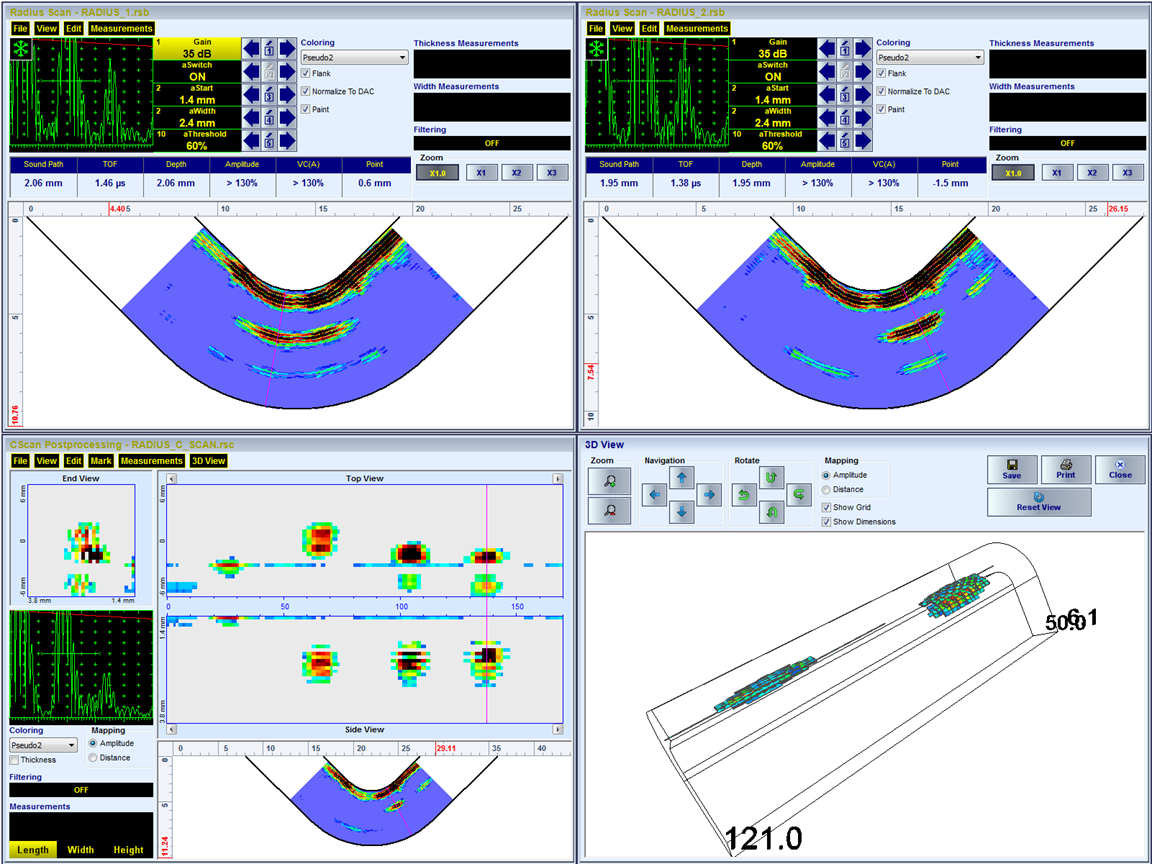
C-Scan & 3D Imaging
For all types of the cross-sectional coverage ISONIC 3510T / ISONIC 3510 provide 3D Data Presentation - Top (C-Scan), Side, and End Projection Views through the line scanning either encoded or time-based with use of the linear array probes at rectangle to the elements count direction
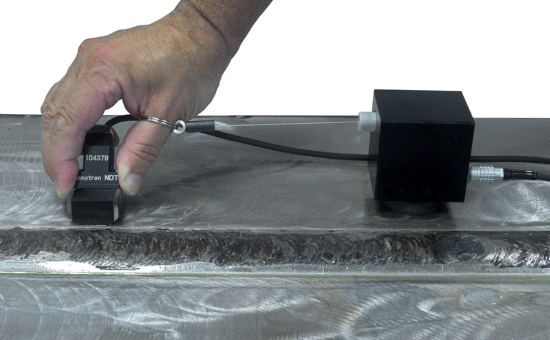
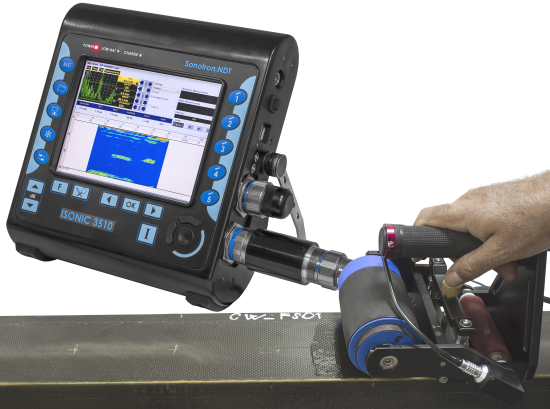
There is a large number of various encoders and scanners available for the True-to-Location recording along the scanning line whilst scanning a wide variety of parts and materials - planar and circumferential butt welds, longitudinal seams, composites, raw materials, and the like. Some encoders and scanners for the line-scanning with use of one phased array probe are presented below. For scanning with a pair of phased array probe click on the DUET tab
This simple encoder is suitable for the quick manual scanning of the short sections (up to 1 meter) of the plates, planar butt welds, longitudinal welds, large OD circumefrential welds, and the like
The videos below illustrate 0-deg compression wave scaning of metallic and carbon fiber material - scanning, 100% raw data capturing, C-Scan and 3D imaging with the use of draw wire encoder SK 2001108 PA
The video below illustrates PA inspection of the stringers made of CRFP composite material - scanning, 100% raw data capturing, C-Scan and 3D imaging with the use of draw wire encoder SK 2001108 PA
The video below illustrates PA inspection of the planar butt weld scanned along the fusion line when the probe position was determined with the use of the draw wire encoder SK 2001108 PA
The video below illustrates inspection of the planar butt weld scanned from both sides in several shots when the probe position was determined with the use of the draw wire encoder SK 2001108 PA
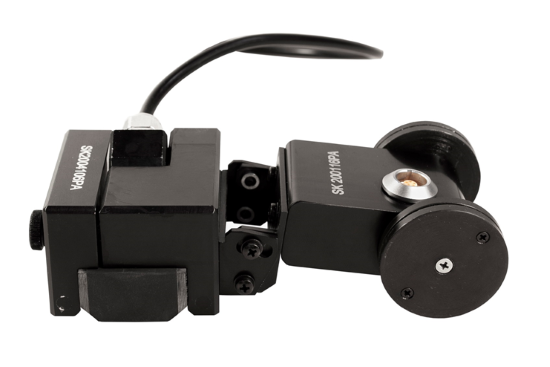
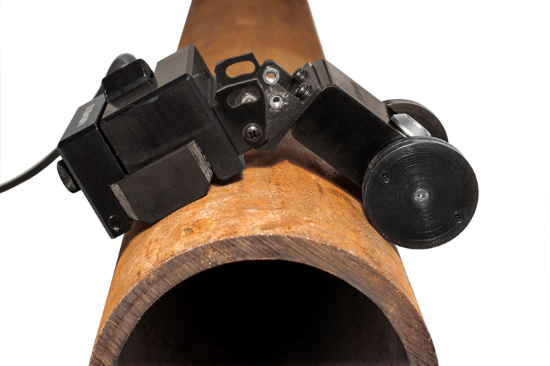
The robust encoder provides stable direction scanning with reliable positioning data. Phased array probe
is fitted into the corresponding probe holder connected to the the encoder. Each probe holder is quipped with the irrigation channel allowing reliable copling along the whole scanning trace
The enccoder 2001116 PA is suitable for the scanning above flat surfaces and pipes with OD of 50 mm and above
The videos below show the use of the encoder 2001116 PA for scanning along the fusion line of the planar and circumferential butt weld with PA probe
Bar encoder SK 2001112 PA
The use of the bar encoder SK 2001112 PA is very efficient for the inspection of long planar and quazi-planar welds, large plates, etc. The encoding element slides along the bar,
which should be placed along the desired scanning line as it is illustrated by the video below
The robust edncoder provides stable direction scanning with reliable positioning data. Phased array probe is fitted into the corresponding probe holder connected to the the encoder. Each probe holder is equipped with the irrigation channel allowing reliable copling along the whole scanning trace
During the line scanning every cross sectional view is recorded along with the complete sequence of raw data A-Scans it is composed of. C-Scan image is switchable between distance (thickness or defects depth) and amplitude map
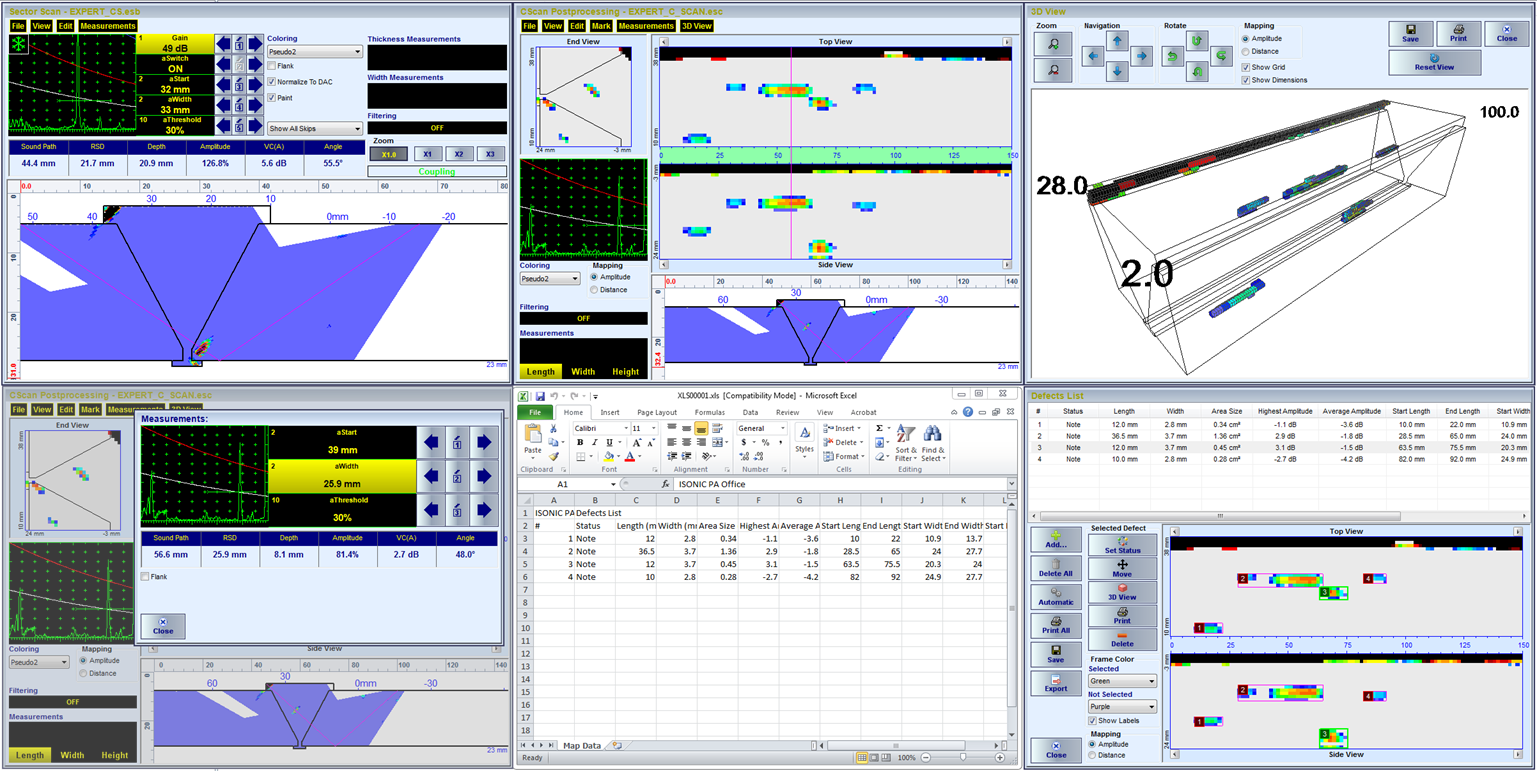
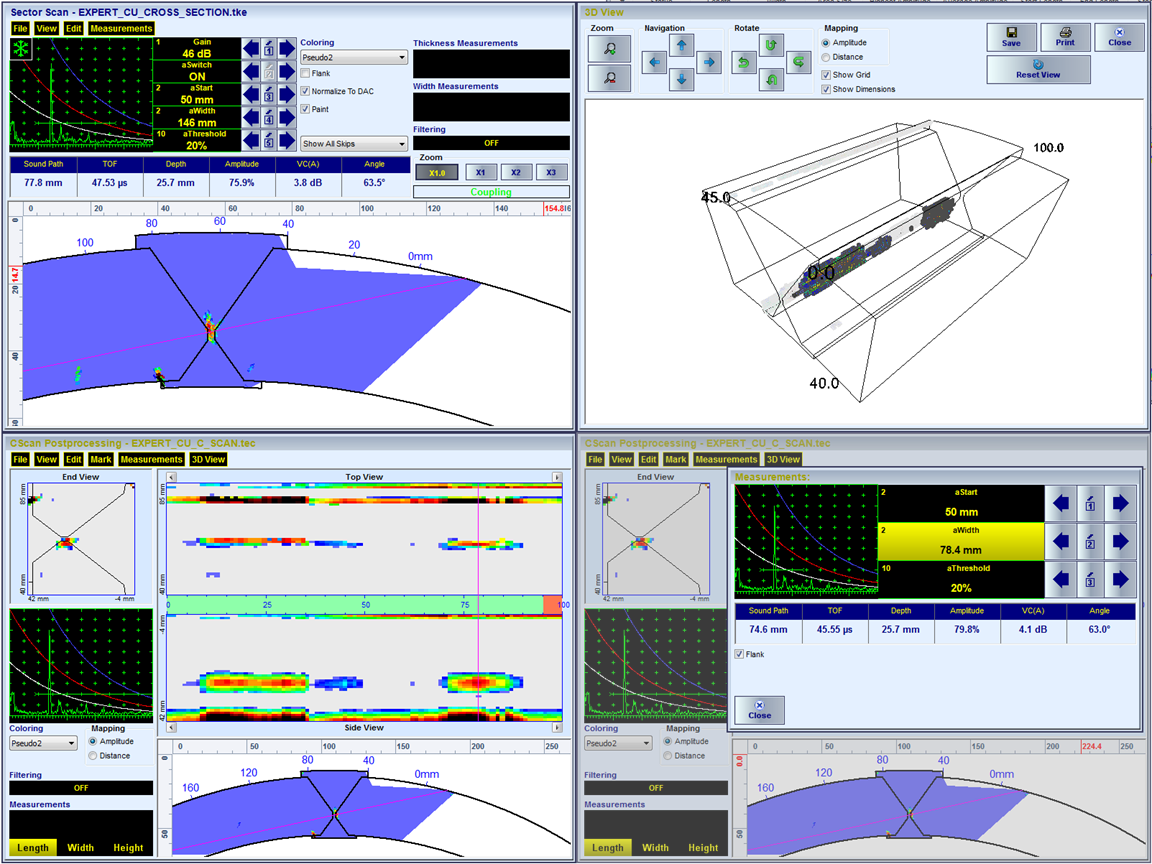
Very powerful off-line data analysis toolkit includes:
Playing back cross sectional views and A-Scans
Gain manipulation in ±6dB range for all recorded A-Scans followed by corresponding update of the cross-sectional, Top-, Side-, End- views
All-standards-compliant gate-based evaluation of the echoes
Geometry and amplitude filtering
Automatic marking of the defects and creating of the defect list
Automatic and manual determining projection dimensions and area size of defects
Image slicing and profiling
3D-viewing
etc
Click on the pictures below to see the exemplary illustrations of the results obtained through the line scanning of various parts and materials
Example # 1: 0-deg compression wave inspection with linear array probe
Example # 2: Inspection of butt welds
Example # 3: Inspection of longitudinal welds
Example # 4: Compression wave inspection of the radius area in the composite stringers
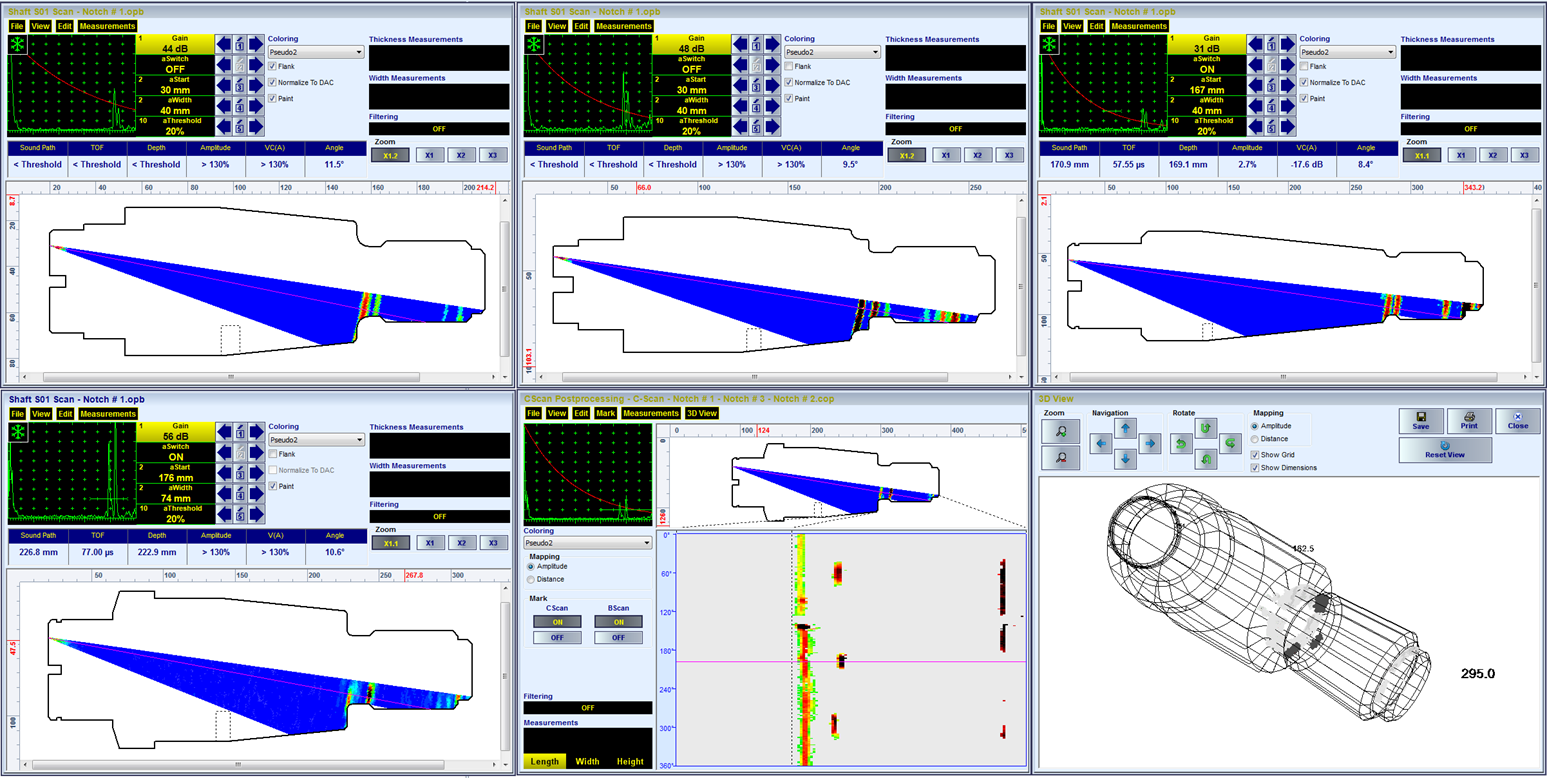
Example # 5: Compression wave inspection of the shafts, bolts, spinled, and the like through the scanning around the flat end surface
Note: In order to accelerate the data stream the videos above are linked to the Youtube. In case the YouTube may not be accessed from your location please use the link below
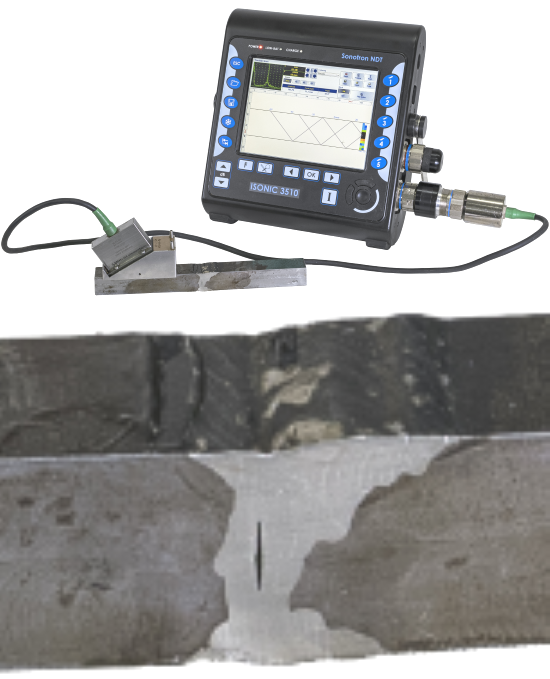
Crack Sizing
Internal Cracks
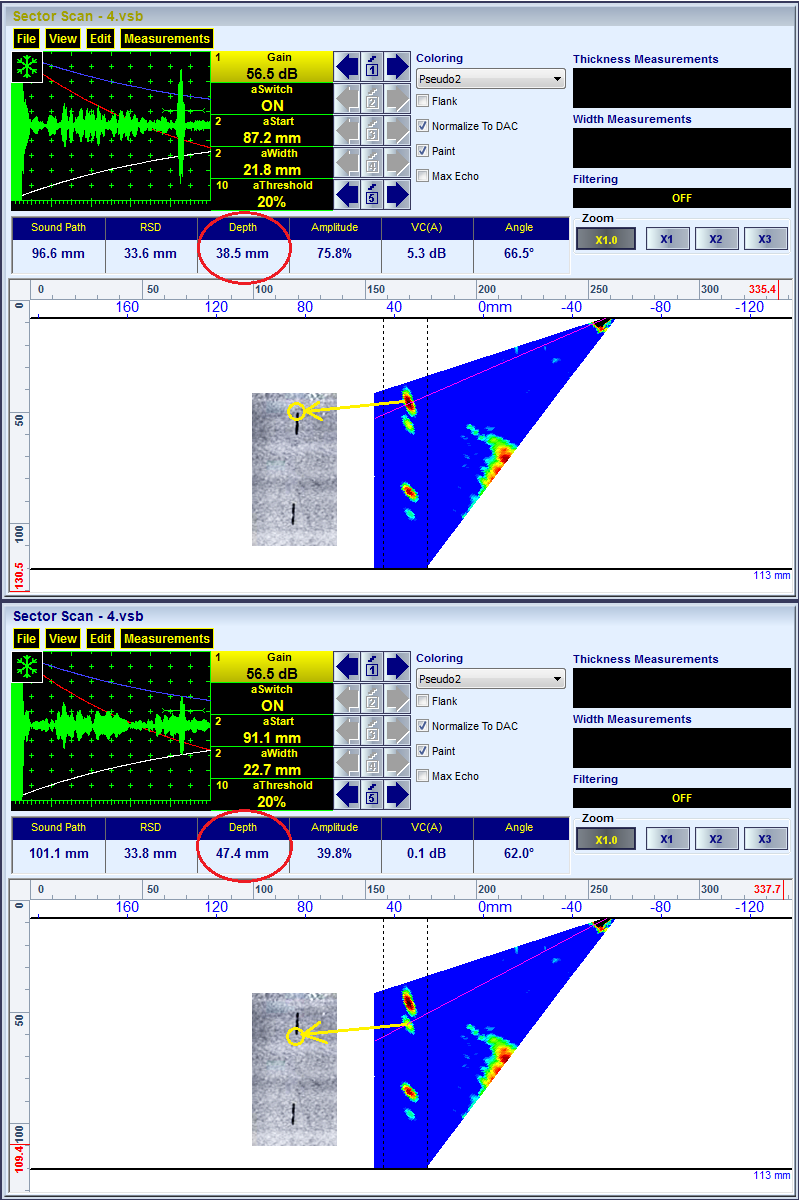
ISONIC 3510T / ISONIC 3510 allow detection and high precision sizing of the internal cracks inside the material based on the analysis of the shear and / or longitudinal wave tip diffraction signals
Shear Wave Diffraction Based Sizing of the Vertical Cracks
Longitudinal Wave Diffraction Based Sizing of the Vertical Cracks
Narrowing the region of interest shortens the time base for the A-Scans forming the cross-sectional coverage view allowing to distinguish between the upper and lower tip of the crack through 180-deg phase shift of the first half wave. This makes it possible applying of the TOFD technique principles whilst scanning with one probe only:
It is important that both the shear and the longitudinal wave cross-sectional coverage either S-Scan or B-Scan or a combination of them may be implemented simultaneously out of the same wedged linear array probe through running of the ISONIC PA MULTIGROUP utility. At last performing of the shear wave and longitudinal wave inspection with crack sizing in a single pass with one PA probe only became possible
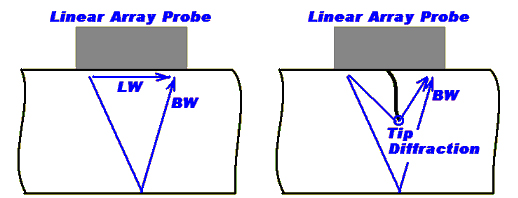
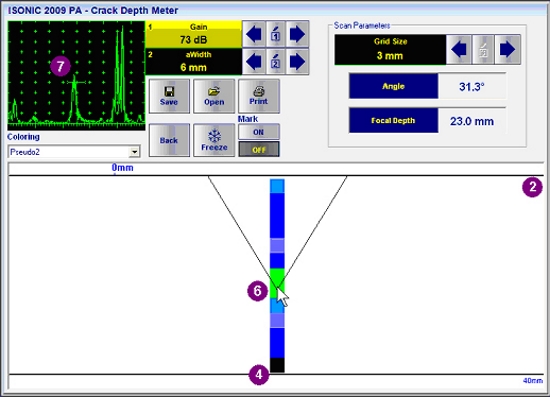
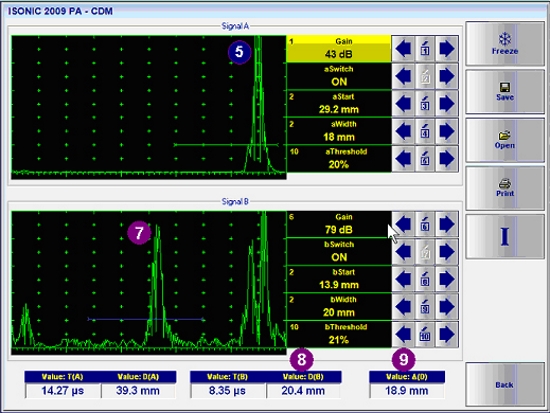
Surface Breaking Cracks
Sizing of the surface-breaking cracks is implemented with use of 64-elements linear array probe. Separated emitting and receiving aperture with matching focal points produce and receive longitudinal wave signals in a sequence containing several pulsing-receiving cycles (focal laws).
The matching focal points of the emitting and receiving aperture are manipulated over the vertical line between the bottom and near surface of the material synchronously.
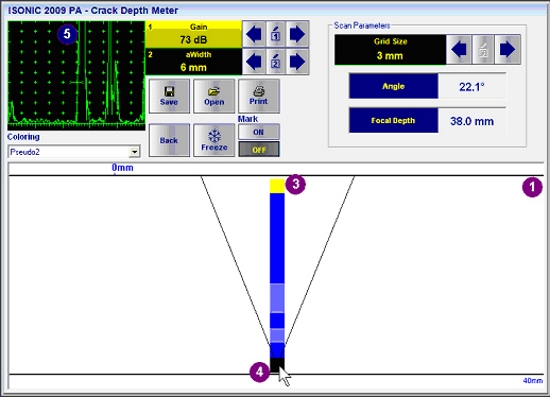
For each focal law the time base of the A-Scan is re-arranged automatically to provide appearance of every possible tip diffraction echo at 50% horizontal position. Recorded signal heights are represented on the Tip Diffraction B-Scan.
Placing mouse cursor over the desired cell of the Tip Diffraction B-Scan reproduces the corresponding A-Scan and the ray trace. For the detected tip diffraction signal the crack depth and the remaining material thickness are determined with high precision (~0.1 mm) through the triangulation routine
Example of the Tip Diffraction B-Scan obtained with the linear array probe placed above the material without (1) and with (2) a surface breaking crack: 3 - lateral wave (LW) signal mark; 4 - back wall (BW) echo mark; 5 - BW echo representation on the A-Scan; 6 - tip diffraction signal mark; 7 - tip diffraction signal appearance on the A-Scan; 8, 9 - precisely defined crack depth and remaining material thickness
The above noted principle and the procedure for sizing of surface breaking cracks are explained by the video below:
Note: In order to accelerate the data stream the video above is linked to the Youtube. In case the YouTube may not be accessed from your location please use the link below
Defects Pattern Analysis
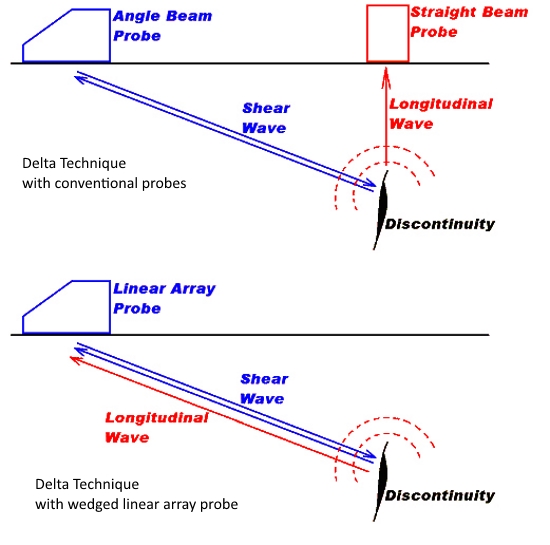
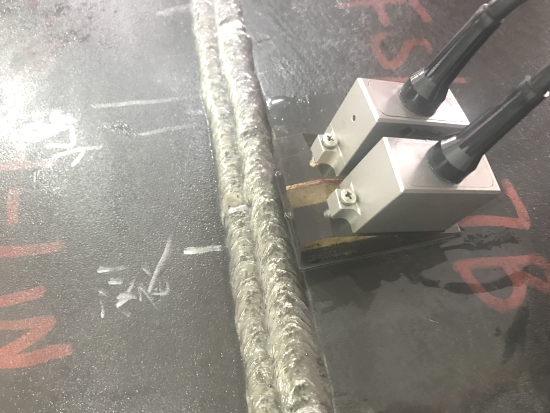
The pattern analysis for the weld imperfections found by pulse-echo technology may be performed by ISONIC 3510T / ISONIC 3510 instrument with the use of well-known Delta Technique.
Comparing to the quite bulky traditional embodiment for the Delta-Technique requiring the use of angle beam shear wave and zero-degree compression wave conventional probes and two different instrument readings to be taken through implementation of
two different calibration sets the phased array technology based solution requires one wedged linear array probe only
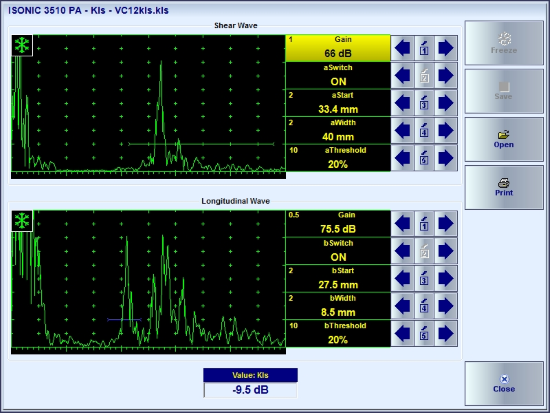
In order to distinguish between the low risk volumetric and the critical sharp edge defects there are just two pulsing-receiving cycles (focal laws) focal laws implemented in sequence:
the first focal law provides emitting of the shear wave towards the discontinuity and receiving of the direct shear wave echo (marked as 1)
the second focal law provides emitting of the shear wave towards the discontinuity and receiving of the diffracted longitudinal wave echo (marked as 2)
The instrument evaluates the above signals automatically and provides the digital readout (marked as 3) for so called KLS value, based on which the defect pattern is recognized
The instrument screen video illustrating the above described defect process of the defect pattern analysis through the comparing of the shear and longitudinal wave echoes is shown below:
The same process may be activated whilst peforming sectorial scan coverage of the material - the instrument screen video is below:
Note: In order to accelerate the data stream the videos above are linked to the Youtube. In case the YouTube may not be accessed from your location please use the links below
Use of the 2D Array Probes
Two-rows 2D Array probes (also known as DLA - Dual Linear Array probes) organized as up 2 X 16 may be connected to ISONIC 3510T / ISONIC 3510 directly;
the probes containing more than 32 elements and organized as 2 X N whereas N < 33 should be connected through the extension terminal (extender) part # S 4922A064D032
The wedged dual linear array probes provide significant improving of the signal-to-noise ratio for some applications related to the compression wave inspection of coarse grain materials, for example stainless steel, CRA, and similar welds
For some inspection applications such as defects detection in the tube-to-tubesheet welds of the heat exchangers, corrosion detection, etc the dual linear array probes with the integrated delay lines may improve the near to surface resolution significantly.
ISONIC 3510 allows performing of both S-Scan and B-Scan coverage with use of dual linear array probes
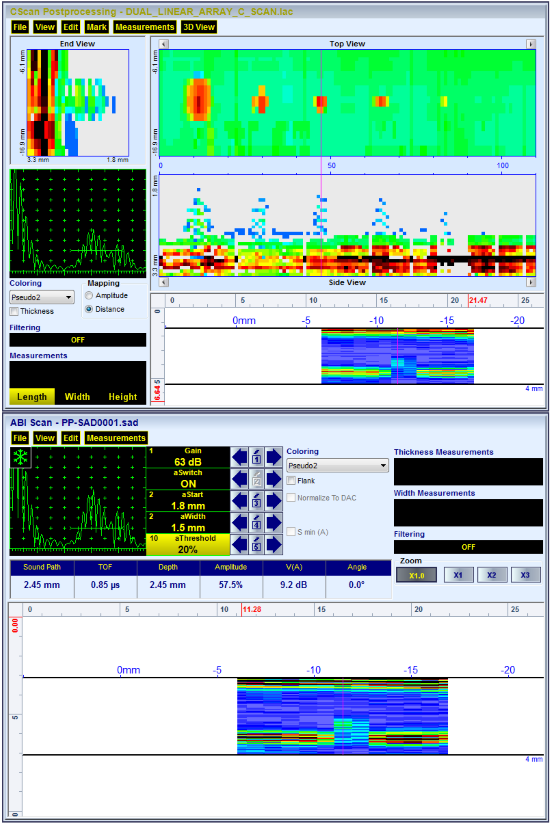
C-Scan and B-Scan images for the 3 mm wall thickness tube with several small imperfections
Use of the Dual Matrix Array Probes (DMA)
ISONIC 3510T / ISONIC 3510 allow the use of wedged DMA probes carrying a pair of matrix arrays comprising M x N elements each. DMA probes allow performing of the beam steering in the cross-sectional plane along with the
swiveling. This increases the flexibility of ultrasonic pulsing receiving thanks to the ability of controlling the depth of the common focal point for the emitting and receiving arrays electronically for the same wedge: in such manner the
signal-to-noise ratio may be optimized very efficiently. The control of the ultrasonic beams is illustrated by the short instrument screen video below:
Both the true-to-geometry (true-to-shape) volume overlay sectorial scan (S-Scan) and the FMC/TFM coverage and imaging are possible while using DMA probes:
The wedged DMA probes allow high performance inspection of the coarse grain welds made of CRA (Corrosion Resistant Alloys), Stainless Steel (Duplex, Super Duplex), and the like through running of
the EXPERT DMA or EXPERT_A DMA Inspection Software Applications:
Note: In order to accelerate the data stream the video above is linked to the Youtube. In case the YouTube may not be accessed from your location please use the link below
3D-Scan
Compression wave 3D-coverage of the material and forming of live 3D-Scan view (ISONIC 3D-Scan L optional SW application) may be performed with the use of full aperture pulsing / receiving
out of 64-elements (8X8) Matrix Array Probe connected to ISONIC 3510T through S 4922A064D032 active functionality extension adapter
as it is illustrated by the videos below:
Note: In order to accelerate the data stream the videos above are linked to the Youtube. In case the YouTube may not be accessed from your location please use the links below
PA UT (PAUT) Applications
Thanks to it's unique smart, flexible, and "teachable" architecture combined with the outstanding ultrasonic performanceISONIC 3510T / ISONIC 3510 provide an ideal platform for the practically unlimited number
of standard and customized inspection software applications, the number of which is increasing permanently. Each application is dedicated to the resolving of the inspection tasks related to the certain class of parts and materials to be tested (the similar shape parts varying by the overall dimensions and the dimensions of particular segments).
Since the part to be inspected is outlined the scan plan is created just in few moments providing the True-to-Geometry Volume Corrected Coverage and imaging. This makes it possible to inspect complex geometry parts easily while the non Sonotron NDT made phased array instruments are practically not applicable
More details about PA AUT applications:
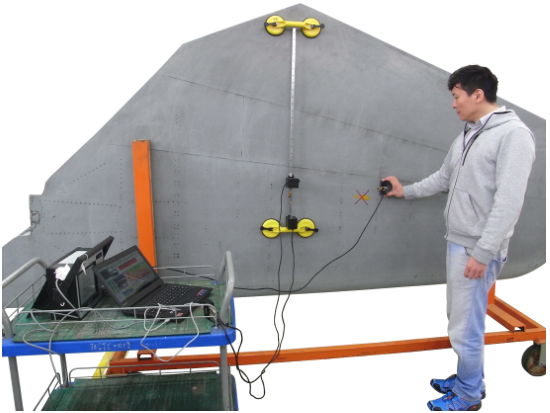
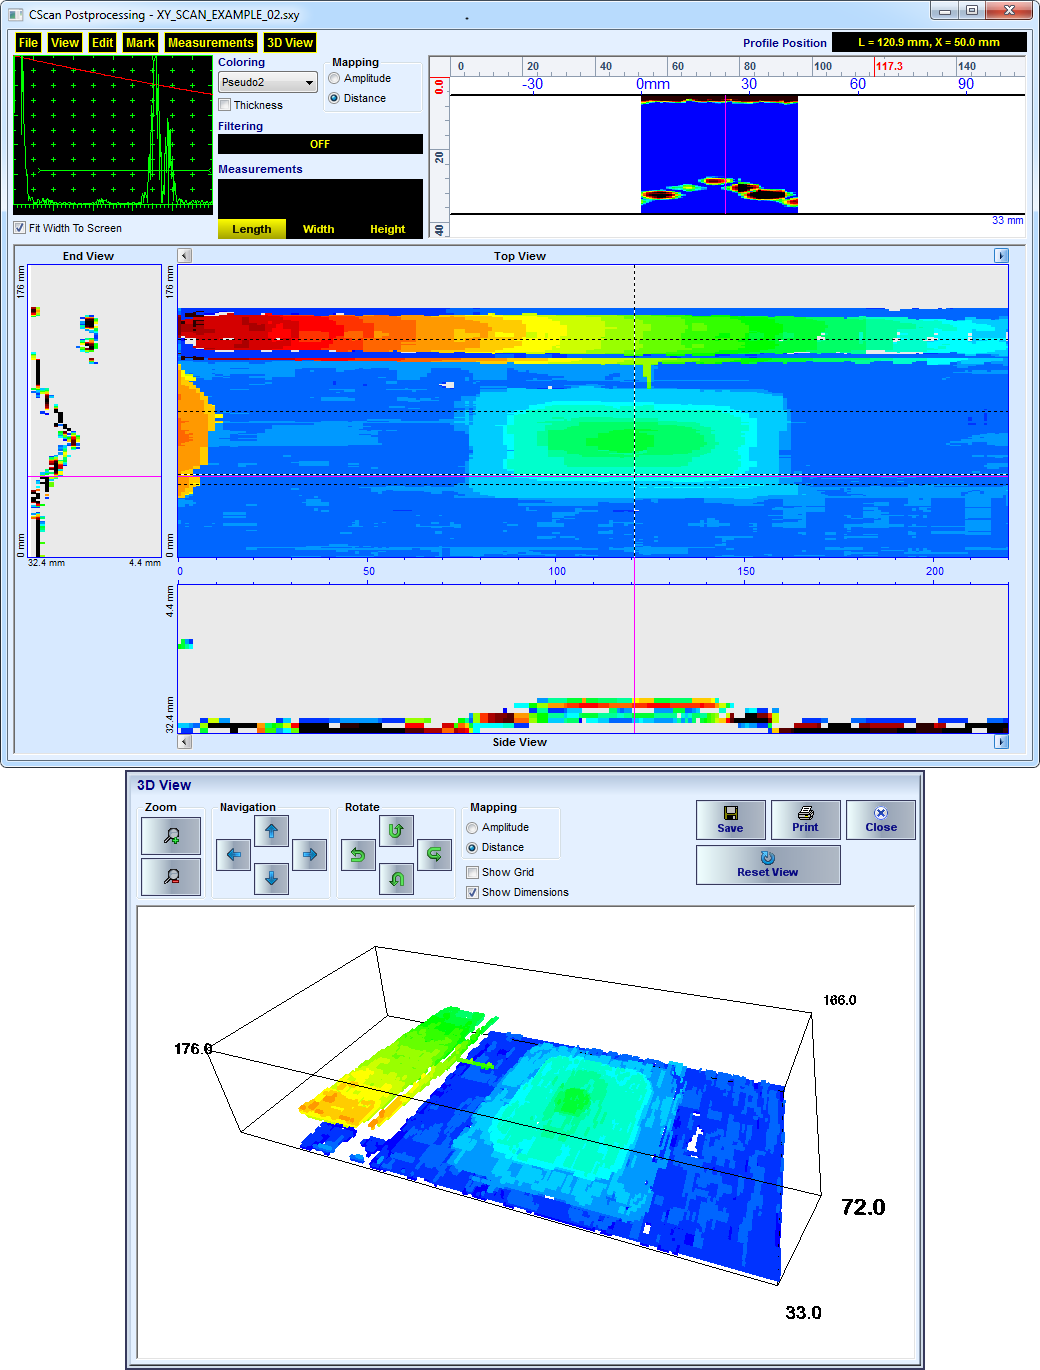
XY (Raster) Scanning
ISONIC 3510T / ISONIC 3510 support the encoded XY-scanning and recording with PA probe for the variety of the inspection tasks
The typical inspection tasks such as corrosion mapping, detection of the impact damages in in the composite panels, flaw detection in various materials, and the like are resolved through to the compression wave inspection with use of linear- or 2D-array probes with / without detachable delay lines, etc.
The XY-Scan software application is required for the said inspections; use of various XY-scanners from the simplest Draw-Wire to the high precision is supported
There is 100%-raw data capturing performed while scanning so the inspection results may be presented in the form of the Amplitude- or Depth C-Scan (switchable), 3D image, various slices either longitudinal, transversal or horizontal, and the like; every cross-sectional view corresponding to the desired probe position and every A-Scan may be played back and evaluated. The data noted above may be reproduced at the various Gain and Gate settings:
The movies below illustrate the examples of simplest embodiment for the encoded XY-scanning, imaging, and recording with use of PA probe
The movie below illustrates some features related to the postprocessing of the XY-Scan data
Note: In order to accelerate the data stream the videos above are linked to the Youtube. In case the YouTube may not be accessed from your location please use the link below
ISONIC Roverscan
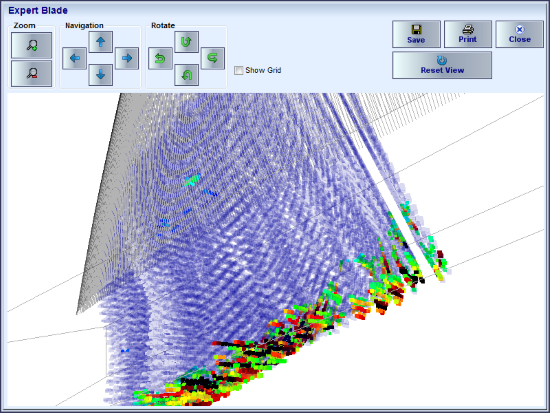
The ISONIC RoverScan technique allows inspecting of the complex geometry parts such as turbine blades, pipe-to-pipe welds, and the like through XY-scanning
In such parts the cross-sectional shape varies along the scanning trace so
the true-to-position material-shape-accommodation of the cross-sectional coverage focal laws is performed by ISONIC 3510T / ISONIC 3510 in real time whilst manipulating PA probe over them; in other
words: for every point of the probe trace the focal laws are accommodated dynamically in order to provide the complete true-to-geometry cross sectional coverage
To follow the ISONIC Roverscan technique the 3D-model (CAD, Parasolid, etc) of the part to be tested is used by the instrument in the following way:
At the pre-inspection stage the 3D-model of the part is ìimplantedî into the instrument's memory as a template
At the scanning stage the coordinates of the PA probe manipulated over the part are taken by the instrument through the appropriate encoding means and the accommodation of the focal laws is performed automatically in real time at every point of the probe trace:
the corresponding true-to-location cross-sectional scan plan (ray tracing) is generated and implemented so the cross-section of the part under the probe is ìfilledî with the ultrasonic beams accordingly providing the needful coverage
the true-to-geometry imaging of the cross-section is provided so on receiving an echo from an obstacle either geometry or internal discontinuity (imperfection) the reflector is imaged in its real position through settling of the appropriate mark on the image
all cross-sectional views obtained during the scanning are pushed into the 3D-template in the instrumentís memory and stored along with the corresponding raw data (A-Scans) sets
On completion of the scanning the 3D-image of the part with the imperfections found is generated
Multi-Axis Encoding
Inspection applications involving special scanners either automatic, manual or robotic are implemented through running of corresponding optional application software utilizing Multi-Axis Encoding of probe position, which is provided
in the ISONIC 3510T / ISONIC 3510 through use of Multi-Axis Encoder Interface Device connected directly to the standard instrumentís terminal usually used with single-axis incremental encoders. Besides counting single-axis encoding ticks controller
of the said terminal settled on the PAUT/UT card of the instrument also carries the ability of real time data exchange. Multi-Axis Encoder Interface Device forms and delivers probe coordinates data stream to PAUT/UT card, which processes
it synchronously with ultrasonic signals in real time. In result the data stream of ultrasonic signals synchronized with probe's coordinates is carried to the instrument's on-board computer for further processing required for resolving
of the inspection task:
Note: In order to accelerate the data stream the video above is linked to the Youtube. In case the YouTube may not be accessed from your location please use the link below
Interface Echo Start - PA Modality
Interface echo (IE) start of the A-Scan time base is a standard function of ISONIC 3510T / ISONIC 3510 and all other PA instruments of ISONIC series
(ISONIC 2010, ISONIC 2009 UPA-Scope, ISONIC PA AUT) whilst utilizing PA modality.
On switching to the B-Scan coverage and imaging the IE start function is applied to every A-Scan within entire sequence of the focal laws implemented provided the ability of performing either immersion (IUT) or
quasi-immersion with use of water filled array probes with flexible silicon tire as it is illustrated by the video below:
The exemplary videos related to the PA IUT (Phased Array Immersion Ultrasonic Testing) are present here:
Note: In order to accelerate the data stream the videos above are linked to the Youtube. In case the YouTube may not be accessed from your location please use the link below
Wedge Verification
Wedged PA probes with flat and curvature contoured contact face are widely used for the shear-, compression-, short range guided wave inspection, and the like
In order to provide precise forming of ultrasonic beams and correct coverage of the material as well as accurate imaging and evaluation of imperfections it is absolutely necessary to enter
parameters of the wedges into the instrument correctly and verify them on regular basis when using because the actual values of wedge parameters may deviate from their nominals:
Wedge Angle depends on the degree of wearing
Ultrasound Velocity in the wedge depends on the ambient temperature and temperature of the part to be inspected, degree of ageing of polymer material it is manufactured of, etc
Position of the First Element above the surface of the material depends on the degree of wearing as well
For that purpose ISONIC 3510T / ISONIC 3510 as well as all other ISONIC series PA instruments such as ISONIC 2010, ISONIC 2009 UPA-Scope,
and ISONIC PA AUT are featured with the simply implemented precise image guided routine, which is explained by the exemplary videos below recorded for the wedges with
Flat contact face
CU-contoured contact face for the longitudinal insonification of tubulars (looking-axially-inspections)
CUC-contoured contact face for the circumferential insonification of tubulars (looking-circumferentially-inspections)
On completion of the verification / correction of the wedge parameters through just shown quick and simple procedures the precision of the material coverage (scan plan), detection, imaging,
and evaluation may be checked on the suitable performance demonstration block in a touch
The most precise results are well achievable then for the real inspections
Note: In order to accelerate the data stream the video above is linked to the Youtube. In case the YouTube may not be accessed from your location please use the link below
Testing Integrity
Along with recording and displaying of the inspection data characterizing the quality of the material the on-line monitoring of scanning performance is provided. The perceptible operative indication is submitted through progressive filling
of the Scanning Performance Strip with green (normal process), red (coupling loss ñ total data loss), and violet (over-speed ñ partial data loss) colors urging the operator to rescan the imperfectly passed segments. The scanning performance
data is recorded synchronously with the inspection data and stored into the same file
100% raw data capturing and homogenized inspection sensitivity over entire cross-section (volume) of the material as determined by the scan plan and the scanning performance data monitored on-line and recorded at parallel with the inspection
results bring testing integrity to the highest level
The video below illustrates the scanning process for the inspection of planar butt weld with 100% raw data capturing and recording and imaging of inspection data along with filling of Scanning Performance Strip:
Quantitative evaluation and reporting of scanning integrity may be obtained immediately on the inspection site for each inspected section of the material or at postprocessing stage as it is illustrated by two exemplary videos below
captured when using linear array and dual matrix array (DMA) probes:
In-line with newly appearing standards and norms setting the quality of PA testing the scanning integrity report reflects:
the actually performed scanned length along with corresponding time consumption and average scanning speed
overall length and percentage of coupling loss segments
overall length and percentage of over speed segments
Note: In order to accelerate the data stream the videos above are linked to the Youtube. In case the YouTube may not be accessed from your location please use the link below
Conventional UT, SRUT GW, TOFD, etc
Besides PA electronics ISONIC 3510T / ISONIC 3510 carries 2 independent top performance conventional channels providing the regular A-Scan and advanced inspections
such as TOFD, Short Range Guided Wave (SRUT GW), CHIME, Multi-Skip Shear Wave, etc with 100% raw data recording each. The said inspections may be performed either independently
or in synchronized combination with PA modality inspection
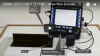
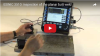
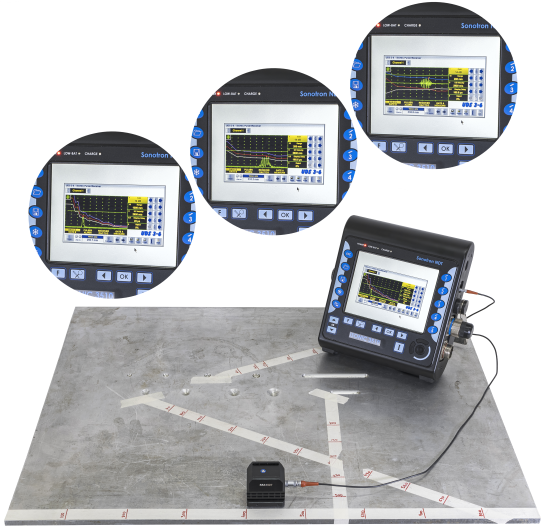
The video below demonstrates the SRUT GW - conventional modality scanning and imaging of the cut-off piece of the annular ring plate with the natural corrosion damages and artificial reflectors:
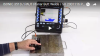
The video below demonstrates the detection of imperfections in tubes using SRUT GW - conventional modality: for longitudinal insonification the standard
reflectors characterizing the requited inspection sensitivity are detectable surely with several meter distanced probe
For single conventional channel operation ISONIC 3510T / ISONIC 3510 provide:
Fully featured A-Scan inspection
Line scanning recording and imaging of the following types:
Thickness B-Scan
True-to-Geometry flaw detection B-Scan for angle and straight beam inspection
Flaw detection CB-Scan for the guided, surface, and shear wave inspection
High resolution flaw detection B-Scan
Fully featured TOFD inspection
Comprehensive postprocessing toolkit
Exemplary videos below demonstrate TOFD A-Scan formed by the conventional channel of ISONIC 3510T / ISONIC 3510 for the sharp edged planar vertical and compact discontinuities and practical TOFD inspection:
This fully corresponds to the scope of functionality provided by the very popular Sonotron NDT's portable ultrasonic flaw detector and recorder
ISONIC 2005 / ISONIC STAR / ISONIC 2020 and its successors
ISONIC 3510T / ISONIC 3510 also provide dual-channel strip chart recording being capable to form the strips of all known types:
B-Scan (Map)
PE (Amplitude + Time of Flight)
TOFD
Coupling
The comprehensive off-line analysis and data reporting toolkit for all kinds of data captured using conventional UT and TOFD modalities is built-in
This fully corresponds to the scope of functionality provided by the very well known Sonotron NDT's portable multi-channel ultrasonic flaw detector and recorder ISONIC 2008 in dual-channel configuration
In the ISONIC 3510T / ISONIC 3510 the conventional and phased array channels may be used simultaneously. For example Sonotron NDT's DUET_M technology supposes the use of a pair of wedged linear array probes for the multi-group inspection of welds from both sides and, at parallel, the use of:
up to 2 additional pairs of regular TOFD probes;
OR
up to 2 pairs of conventional angle beam shear wave probes for the K-Pattern pitch-catch detection of the transversal cracks
OR
combining of the above
Note: In order to accelerate the data stream the videos above are linked to the Youtube. In case the YouTube may not be accessed from your location please use the link below
Utilizing PA Channels for Driving Arrays of Conventional Probes
For a variety of practical inspection tasks use of arrays composed out of a number conventional probes is more efficient comparing to PA modality. Use of 16-, 32-, or more channels high productivity automatic platforms may be justified just for
the factories or other sites with continuously running manufacturing process. Use of portable stand-alone multi-channel instrument is more cost effective but purchasing of such units may be not justified by every small / medium size inspection
companies just for the resolving of occasionally occurring inspection projects
Anyway, the owner of ISONIC Series portable instrument such as ISONIC 3510T / ISONIC 3510, ISONIC 2010, ISONIC 2009 UPA Scope may resolve various inspection
tasks using arrays of conventional probes utilizing PA channels easily whilst connecting conventional probes to PA channels using the splitter box SA 36895870:
Note: In order to accelerate the data stream the video above is linked to the Youtube. In case the YouTube may not be accessed from your location please use the link below
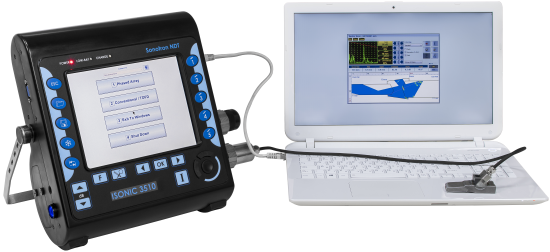
UT over IP - Remote Control and Data Acquisition
Thanks to the Client ñ Server software architecture ISONIC 3510T / ISONIC 3510 may be controlled remotely from a regular PC running under WiníXP, 7, 8, 10, 11. There is no need in the special software for that purpose,
just download and install in the PC the same software as used in the instrument
The software installed in the PC should be of the same release as the software running in the ISONIC 3510T / ISONIC 3510 and correspond to the instrument model
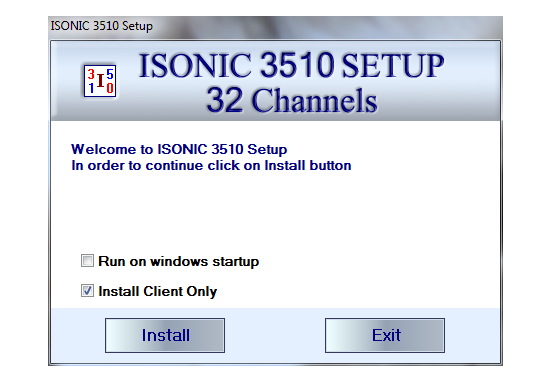
Installing the Instrument Software in the PC
Upon started the installation routine generates the dialogue as below on the PC screen:
It is necessary to check Install client only and uncheck Run on windows startup option then to click on Install button. Further actions are taken by the installation routine automatically
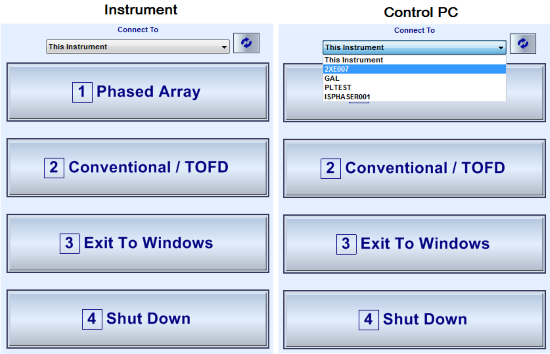
Controlling the Instrument from the PC
The instrument and the computer should be connected to the same LAN or Wi-Fi and obtain the IPs automatically. The initial Startup menu (Start Screen) appearing upon powering the instrument on and booting up completed
should be kept on the unit's screen at the time of establishing the remote connection and control. In the computer the same software should be launched: on appearing of the Startup menu it is necessary to select the instrument
to be controlled from the list of the available Idle units:
Once the connection is established ISONIC 3510 unit enters into the slave mode being connected to the probes and encoder and running the just the server routine while the computer performs full control of the instrument,
data acquisition, processing, and storage on the local drives through running of the client software in the same manner as the instrument does when operating autonomously
The video below illustrates the UT over IP feature:
Extremely simply and quickly implementable UT over IP mode of operation is the standard feature of all ISONIC series portable instruments, namely
For all above listed units the remote control and data acquistion are realized in the same manner as it is shown in the present video
An example of using UT over IP technology as one of the means for facilitating the work of PAUT operator is illustrated and explained by the video below:
Note: In order to accelerate the data stream the videos above are linked to the Youtube. In case the YouTube may not be accessed from your location please use the link below


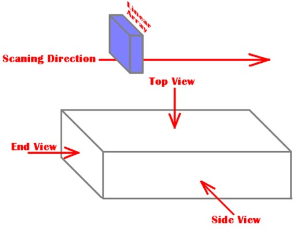 For all types of the cross-sectional coverage ISONIC 3510T / ISONIC 3510 provide 3D Data Presentation - Top (C-Scan), Side, and End Projection Views through the line scanning either encoded or time-based with use of the linear array probes at rectangle to the elements count direction