

|

|
 | Evaluation of Type and Dimensions of Discontinuities Through Three Dimensional Ultrasonic Imaging Y. Shoef, G. Shoef - Gabi Shoef Ltd., G. Passi - Sonotron, I. Segal - Technion, Israel |
1. Introduction
- Ultrasonic testing of welded joints is in widespread use in industrial applications. The demand for higher reliability of inspection and recorded results of the inspection led to the development of inspection systems with P-Scan presentation. This presentation shows up and side projections of the discontinuity image. This presentation is obvious to all personnel involved with the inspection results as welding inspectors, welders, and project engineers even though they are not acquainted with the test method itself.
In spite of the fact that the indication of the discontinuity is clearly shown, it can be ascribed to its size and shape in general terms only. While inspecting with A-Scan presentation equipment, which has one dimension display, clear criteria are set for acceptance or rejection of the flaw. These criteria are comparison of the reflection coming from the flaw and from an artificial flaw. Using graphs as DGS and AVG give the possibility to evaluate the size of the detected flaw as an equivalent ideal reflector.
These tools of evaluation do not exist for the 3D presentation and therefore prevent usage in conjunction with existing standards.
The purpose of this study is to develop calculated images. These images will be obtained according the ultrasonic inspection parameters and will predict the image that is supposed to come as result of the inspection. This can serve as a tool for evaluating the size of the discontinuity and to distinguish between two different types of flaws those have similar images.
2. Methodology
- The ultrasonic reflection received by the search unit is affected by many different parameters. In order to calculate and obtain images of different common discontinuities, a mathematical model has to be established. There are two possible models: the Geometric Model (fig 1) and the Energy Model (fig 2). The first is based on the surface location of the search unit with the consideration that the probe receives the strongest reflection from a reflector while it is located right on its axis. This model calculates the geometric relations and can give an estimated size of the reflector. This model does not allow calculate the signal received from discontinuities located off axis as exist actually and therefore is not suitable to obtain the simulated images.
- The wave is not monochromatic
- The wave is produced by a Piston-shape element
- Surface is ideally smooth
- Temperature is nominal
- Reflection Factor for internal discontinuities is the same as for Steel-Air boundary
- Reflection Amplitude relates to the first reflection
- Acoustic pressure curve behaves as spherical wave at 2 Near Zones and further
- Δr in the transducer is homogenous
Fig 1: The Geometric Model
 |  |
| Fig 2: The Energy Model | |
Using the Energy Model will take in account all the ultrasonic relevant parameters and will make a better simulation of the actual response of the discontinuity. It will calculate the full two-way path of the acoustic wave and will consider all energy variables such as couplant efficiency, reflections off acoustic beam axis and others.
This model uses equations [1,7] dealing with energies or amplitudes received from different standard reference reflectors. The following equation (1) is formed:
Mathematical analysis was done to the ultrasonic echoes for providing computerized modeling of the discontinuity images, and simulation of a computerized scan was done for getting the calculated images.
After having the reference-calculated images, still remains the need to verify the mathematical model and to check if these calculated images comply with practical images. If the correlation is above a determined threshold, that is the level of uncertainty recognized to exist in ultrasonic inspection, then the method described in this study can initiate construction of a commercial system that will increase the reliability of the ultrasonic inspection.
Correlation between the calculated image and an actual one was done in two complimentary ways. The first known as Image Registration [2] and in describe in (2):
An ideal match between images will result with a value of 1.0 for this expression.
This is correlation of the two images that relate to their shape only regardless of their power or amplitude. We can see an example of two images with the same shape and different power that will give correlation value of one.
 |  |
| Fig 3: Same shape different power | |
In order to gain differentiability for power difference a second type of correlation was developed (3). It calculates the variance over all the pixels consisting the image. The variance value can be related to the square of the uncertainty.
An ideal match between images will result with a value of zero for this expression.
Criteria for good correlation between model and actual results
Actual scans have been done in different inspection parameters such as: frequencies, angles, scan index and common used reflectors. There was a need to define what is considered to be a good match between a computed image and an actual one. This was decided to be the value of a tolerated uncertainty as in ultrasonic testing. Chapman [3] calculated a value of 4.9 mm with a confidence level (CL) OF 80% for 2.5 MHz, 45° beam ultrasonic examination. Forly and Pettersen [4] reported on operator mistake of 3dB to 10 dB (that means that the same operator will have 3dB to 10 dB difference in his reported results of two consecutive tests). Berke [5] report on equivalent of 2dB difference between actual results and DGS diagrams (for A scan). The Nordtest Report [6] says the Standard Deviation in manual ultrasonic tests of butt welds found to be 4.81 dB (Variance of 12dB).
Considering the above it has been decided that a correlation which is better than this received from two images with a difference of 4 dB will be consider as satisfactory and will approve the proposed way of creating reference images.
The ultrasonic inspection method involves complicated physical processes. In order to calculate an image and create a model, few postulates must be taken. They should be justify by both the nature of the examination parameters and the total result that will give an image that does not differ in more then the accepted correlation.
The following postulates were taken:
4. Materials and Methods
- For doing the actual scans an ultrasonic P-Scan apparatus (Fig 4) [8] was used. This instrument can make a manual scan of a weld in order to detect and display the discontinuities with a predetermined sensitivity. Three types of data are displayed graphically - Top view of the weld including the discontinuities, Side view of the weld including the discontinuities, and probe trajectory on the surface. The last one improves the reliability of the examination by alerting areas with insufficient coupling or non-scanned areas.
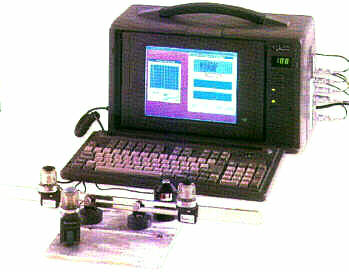
Fig 4: Ultrasonic Apparatus
 Fig 5: User Interface System |
Special algorithms were developed for providing a virtual scan of the part; this is a full simulation of the part inspection including the necessary scan pattern (towards and backwards the weld), and a determined scan index. At every point of that scan the amplitude was calculated by equation (1).
A User Interface system (Fig. 5) was prepared in order to define the parameters of the simulated scan (index, frequency, beam angle) and the virtual discontinuity and its parameters (location, size and type).
Test blocks containing artificial reference discontinuities were prepared. These blocks were made of Aluminum and have common used reflectors such as Notch, Vertical Drilled Hole (VDH), Side Drilled Hole (SDH) and Flat Bottom Hole (FBH).
5. Experiments
- Total of 46 experiments were done to cover the entire range of parameters used for ultrasonic weld examination. This parameters are as follow:
Reference reflectors
The reference reflectors were as required by international standards:
SDH - required by ASME VIII for pressure vessels and others (diameters 3, 5 mm)
FBH - required by MIL-STD-2154 and some aircraft manufacturer specifications. (diameters 2.5 mm)
VDH - required by API 5L for petroleum piping (diameters 0.9, 1.2, 1.9, 3.2 mm)
Notch - required by ASTM, ASME VIII and others. (30 mm long, 1 mm deep)
Frequencies - 2 and 4 MHz.
Beam Angle - 45°, 60°, 70°
Scan Index - 1mm, 2mm, 4mm
 Fig 6: Calculated and Actual image |
The right side of Fig.6 shows both the calculated (on the left) image and the actual (on the right) image of a SDH reflector. Two correlation windows with the same size appear on the right side of the screen. These windows can be manipulated to be located on the two images.
The results of the correlation as calculated by (2) appear on the display next to the "Correlation" button on the left bottom part of fig 6. The results of the uncertainty as calculated by (3) appear on the display next to the "Anti-Correlation" button on the left bottom part of fig 6.
6. Results
- The results presented hereby express the matching between a proposed image model and an actual image. The values are in dB difference or in correlation scale that is between the values 0 to 1.
Different aspects of the examination parameters are shown.
Dependence upon Beam Angle
Fig. 7 shows significant dependence upon the beam angle for reflectors that are not symmetric to the angle (i.e. Notch and VDH). The reason for that was investigated and found to be due to significant change of the coupling coefficient between Perspex and Aluminum to other than 1.0 as assumed, for the angles that are far from the beam axis. The behavior of this value is known and can be related in future calculations.
 |  |
| Fig 7: Uncertainty vs. Flaw Type and Beam Angle | |
Dependence upon Reflector Size
Fig. 8 shows better match for larger reflectors, and better match for higher frequencies.
 Fig 8: Uncertainty vs. Flaw Reflector Size |  Fig 9: Sensitivity for Scan Index Variation |
Dependence upon Scan Index
It can be seen from Fig. 9 that the scan index has no effect on the accuracy of the proposed method. This is expected because the same scan index is used for the actual scan and for the virtual scan. This is correct as far as the scan index does not exceed the overlap required between two adjacent scan lines. This results as an economic meaning as the scan density affect the time required to complete the test.
Evaluation of type of discontinuity
The suggested tool leads to possibility for the assessment of the nature of an image. This can be done by finding if an image that is obtained by certain ultrasonic inspection matches better to a known image i.e. to a Lack of Penetration or Crack or Pore or other discontinuity image.
A test case done in the described work show poor correlation between images created by scanning different types of discontinuities, which means good identification.
6. Discussion
- A good correlation between a suggested model and actual images was found. The calculations were done for one projection only but the same procedure can be engaged for the second projection. A combined correlation of the three dimensional image will improve the differentiation by producing higher correlation values.
- Acoustic Coupling
- Different surface quality
- Attenuation for austenitic material and castings
- Beam spread as a function of inclination between the reflector and beam
- More frequencies in the range 1 Mhz to 10 Mhz
The mathematical model and the method were approved. A new possibility was created to apply the standards that define maximal size of discontinuity and not its image size. Furthermore, it is feasible to develop a system that can solve the inverse problem by making a guess of the unknown discontinuity, generating a calculated image, and converge by means of Numeric Analysis methods till getting minimal value of uncertainty.
It is now possible to produce a calculated image of the maximal allowed discontinuity, according the relevant standard that will appear on the screen. The operator will compare the images resulting from the inspection to the marginal reference image. He also may receive the calculated uncertainty of the decision he is going to take about the nature and size of the discontinuity and therefore the accept / reject judgment.
Further investigation
Further investigation of the secondary parameters may enhance the usefulness of the model for some materials and special test cases. These parameters are:
Considering these parameters will lead to reduction of the uncertainty values involved in this novel method.
7. References
- J. Krautkramer, H. Krautkramer, Ultrasonic Inspection of Materials, Springer-Verlag, 1969, pp. 61,487, Berlin Heidelberg.
- William K. Pratt, Digital Image Processing, Second Edition, A Wiley Interscience Publication: John Wiley and Sons,1991, pp. 651-673; New York - Chichester - Brisbane - Toronto.
- R.K. Chapman - CEGB Guidance Document on the Assessment of Defect Measurement Errors in the Ultrasonic NDT of Welds, Reliability in NDT - NDT-88, Proceedings of the 27th Annual British Conference on NDT, pp. 173-185, 1988, UK.
- O. Forly, B. Pettersen, The Uncertainty of Non-Destructive Examination, EURO 87 proceedings, a conference organized by the British Institute of NDT, vol. 2 pp. 832-843, 1987, UK
- M. Berke - Krautkramer, DGS and Reference Block Methods, 7th ECNDT Proceedings Vol. 3, 3070-3076, 1998, Copenhagen
- B. Steffen, H. Kallio, Nordtest Report NT TECHN REPORT 251, Project No. 1013-91-7, Traceable calibration and Uncertainty of Measurements and Tests, pp. 87-94, 1994
- A. Gurvich, I. Ermolov, Ultrasonic Inspection of Welds, Technique Publication, pp. 22-23, 1972, Kiev
- G. Passi, Y. Shoef, M. Kritsky, Reducing Influence of Human Factors on the Manual Ultrasonic Weld Inspection Reliability, INSIGHT British Journal Of NDT Volume 37 Number 10, UK